Resampling Data
What Is Resampling?
Resampling data signals in the System Identification Toolbox™ product applies an antialiasing (lowpass) FIR filter to the data and changes the sampling rate of the signal by decimation or interpolation.
If your data is sampled faster than needed during the experiment, you can decimate it without information loss. If your data is sampled more slowly than needed, there is a possibility that you miss important information about the dynamics at higher frequencies. Although you can resample the data at a higher rate, the resampled values occurring between measured samples do not represent new measured information about your system. Instead of resampling, repeat the experiment using a higher sampling rate.
Tip
You should decimate your data when it contains high-frequency noise outside the frequency range of the system dynamics.
Resampling takes into account how the data behaves between samples, which you specify when you import the data into the System Identification app (zero-order or first-order hold). For more information about the data properties you specify before importing the data, see Represent Data.
You can resample data using the System Identification app or the resample command. You can only resample time-domain data at uniform time
intervals.
For a detailed discussion about handling disturbances, see the chapter on preprocessing data in System Identification: Theory for the User, Second Edition, by Lennart Ljung, Prentice Hall PTR, 1999.
Resampling Data Without Aliasing Effects
Typically, you decimate a signal to remove the high-frequency contributions that result from noise from the total energy. Ideally, you want to remove the energy contribution due to noise and preserve the energy density of the signal.
The command resample performs the decimation without aliasing
effects. This command includes a factor of T to normalize the spectrum
and preserve the energy density after decimation. For more information about spectrum
normalization, see Spectrum Normalization.
If you use manual decimation instead of resample—by picking
every fourth sample from the signal, for example—the energy contributions from higher
frequencies are folded back into the lower frequencies("aliasing"). Because the total signal
energy is preserved by this operation and this energy must now be squeezed into a smaller
frequency range, the amplitude of the spectrum at each frequency increases. Thus, the energy
density of the decimated signal is not constant.
This example shows how resample avoids folding effects.
Construct a fourth-order moving-average process.
m0 = idpoly(1,[ ],[1 1 1 1]);
m0 is a time-series model with no inputs.
Generate error signal.
e = idinput(2000,'rgs');Simulate the output using the error signal.
sim_opt = simOptions('AddNoise',true,'NoiseData',e);
y = sim(m0,zeros(2000,0),sim_opt);
y = iddata(y,[],1);
Estimate the signal spectrum.
g1 = spa(y);
Estimate the spectrum of the modified signal including every fourth sample of the original signal. This command automatically sets Ts to 4.
g2 = spa(y(1:4:2000));
Plot the frequency response to view folding effects.
h = spectrumplot(g1,g2,g1.Frequency);
opt = getoptions(h);
opt.FreqScale = 'linear';
opt.FreqUnits = 'Hz';
setoptions(h,opt);

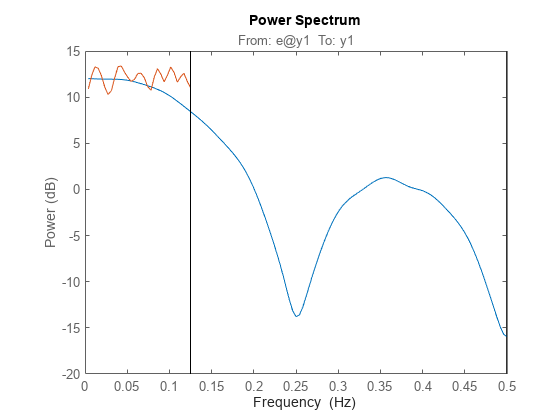
Estimate the spectrum after prefiltering that does not introduce folding effects. Use resample to decimate the signal before estimating the spectrum and plot the frequency response.
g3 = spa(resample(y,1,4));
figure
spectrumplot(g1,g3,g1.Frequency,opt)

The plot shows that the estimated spectrum of the resampled signal has the same amplitude as the original spectrum. Thus, there is no indication of folding effects when you use resample to eliminate aliasing.