fcm
Fuzzy c-means clustering
Syntax
Description
FCM is a clustering method that allows each data point to belong to multiple clusters with varying degrees of membership. For more information, see Fuzzy C-Means Clustering.
[ returns the clustering results for all numbers of clusters
used along with the validity index used for determining the optimal number of clusters.
When the distance metric specified in centers,U,objFcn,info]
= fcm(___)options is either
"mahalanobis" or "fmle", info also
contains the covariance matrices generated for each number of clusters.
Examples
Load the data to cluster. Each row of fcmdata contains one data point. The two columns of fcmdata contain the feature values for each data point.
load fcmdata.datSpecify clustering options using an fcmOptions object. For this example, set the number of clusters to 2 and use default values for the other options.
options = fcmOptions(NumClusters=2);
Find the cluster centers using fuzzy c-means clustering.
[centers,U] = fcm(fcmdata,options);
Iteration count = 1, obj. fcn = 8.97048 Iteration count = 2, obj. fcn = 7.1974 Iteration count = 3, obj. fcn = 6.32558 Iteration count = 4, obj. fcn = 4.58614 Iteration count = 5, obj. fcn = 3.89311 Iteration count = 6, obj. fcn = 3.8108 Iteration count = 7, obj. fcn = 3.7998 Iteration count = 8, obj. fcn = 3.79786 Iteration count = 9, obj. fcn = 3.79751 Iteration count = 10, obj. fcn = 3.79744 Iteration count = 11, obj. fcn = 3.79743 Iteration count = 12, obj. fcn = 3.79743 Minimum improvement reached.
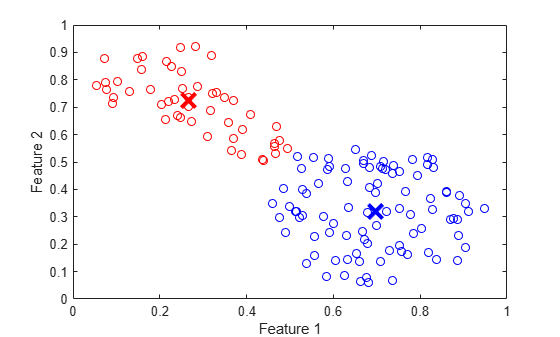
Classify each data point into the cluster with the largest membership value.
maxU = max(U); index1 = find(U(1,:) == maxU); index2 = find(U(2,:) == maxU);
Plot the clustered data and cluster centers.
plot(fcmdata(index1,1),fcmdata(index1,2),"ob") hold on plot(fcmdata(index2,1),fcmdata(index2,2),"or") plot(centers(1,1),centers(1,2),"xb",MarkerSize=15,LineWidth=3) plot(centers(2,1),centers(2,2),"xr",MarkerSize=15,LineWidth=3) xlabel("Feature 1") ylabel("Feature 2") hold off
Create a random data set.
data = rand(100,2);
Specify the following FCM clustering options.
Compute two clusters.
To increase the amount of fuzzy overlap between the clusters, specify a large fuzzy partition matrix exponent.
Suppress the command-window display of the objective function values for each iteration.
options = fcmOptions(... NumClusters=2,... Exponent=3.0,... Verbose=false);
Cluster the data.
[centers,U] = fcm(data,options);
Load the clustering data.
load clusterDemo.datConfigure an options object for computing three clusters and suppress the command-window output of the objective function values. Also, set the clustering termination conditions such that the optimization stops when either of the following occurs:
The number of iterations reaches a maximum of 50.
The objective function improves by less than 0.001 between two consecutive iterations.
options = fcmOptions(... NumClusters=3,... MaxNumIteration=50,... MinImprovement=0.001,... Verbose=false);
Cluster the data.
[centers,U,objFcn] = fcm(clusterDemo,options);
To view the progress of the clustering, plot the objective function.
plot(objFcn) title("Objective Function Values") xlabel("Iteration Count") ylabel("Objective Function Value")
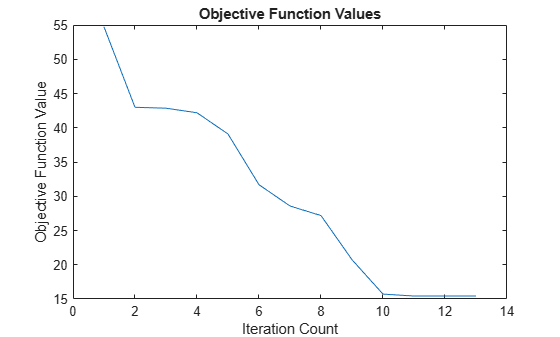
The length of the objective function vector is less than 50; therefore the clustering did not reach the maximum number of iterations.
View the final three values of the objective function vector.
objFcn(end-2:end)
ans = 3×1
15.4353
15.4306
15.4305
The optimization stopped because the objective function improved by less than 0.001 between the final two iterations.
Load the data to cluster.
load clusterDemo.datSpecify the clustering options. For this example, cluster the data three times, once each for 2, 3, and 4 clusters. Suppress the command-window output.
options = fcmOptions(... NumClusters=[2 3 4],... Verbose=false);
Cluster the data. The results returned in centers, U, and objFun correspond to the optimal number of clusters. The results for all cluster counts are returned in info.
[centers,U,objFun,info] = fcm(clusterDemo,options);
View the optimal number of clusters.
Nc = info.OptimalNumClusters
Nc = 3
Verify the optimal number of clusters using the validity index values, which correspond to the cluster counts specified using NumClusters. The optimal number of clusters corresponds to the smallest validity index.
info.ValidityIndex
ans = 1×3
0.3258 0.1891 5.1597
The smallest validity index corresponds to a cluster count of 3.
Plot the clustered data using the optimal clustering results. First classify each data point into the cluster with the largest membership value.
maxU = max(U); index1 = find(U(1,:) == maxU); index2 = find(U(2,:) == maxU); index3 = find(U(3,:) == maxU);
Plot the clustered data and cluster centers.
figure
hold on
scatter3(clusterDemo(index1,1),clusterDemo(index1,2),...
    clusterDemo(index1,3))
scatter3(clusterDemo(index2,1),clusterDemo(index2,2),...
    clusterDemo(index2,3))
scatter3(clusterDemo(index3,1),clusterDemo(index3,2),...
    clusterDemo(index3,3))
plot3(centers(:,1),centers(:,2),centers(:,3), ...
    "xk",MarkerSize=15,LineWidth=3)
xlabel("Feature 1")
ylabel("Feature 2")
zlabel("Feature 3")
view([-11 63])
hold off

Load the data to cluster.
load clusterDemo.datEstimate the number of clusters (Nc) and the initial cluster centers (initCenters). For this example, use the subclust function.
initCenters = subclust(clusterDemo,0.5);
Nc = size(initCenters,1);
Configure the FCM clustering to use the initial cluster centers as a starting point.
options = fcmOptions(...
    NumClusters=Nc, ...
    ClusterCenters=initCenters);
Cluster the data.
[centers,U] = fcm(clusterDemo,options);
Iteration count = 1, obj. fcn = 103.934
Iteration count = 2, obj. fcn = 15.7792
Iteration count = 3, obj. fcn = 15.7792
Minimum improvement reached.
With initial estimates of the cluster centers, the FCM algorithm converges quickly.
Input Arguments
Output Arguments
Tips
To generate a fuzzy inference system using FCM clustering, use the
genfisfunction. For example, suppose that you cluster your data using the following syntax.[centers,U] = fcm(data,fcmOpt);
The first
Mcolumns ofdatacorrespond to input variables and the remaining columns correspond to output variables.You can generate a fuzzy system using the same training data and FCM clustering configuration. To do so:
Configure the clustering options.
opt = genfisOptions("FCMClustering");
opt.NumClusters = fcmOpt.NumClusters;
opt.Exponent = fcmOpt.Exponent;
opt.MaxNumIteration = fcmOpt.MaxNumIteration;
opt.MinImprovement = fcmOpt.MinImprovement;
opt.DistanceMetric = fcmOpt.DistanceMetric;
opt.Verbose = fcmOpt.Verbose;
Extract the input and output variable data.
inputData = data(:,1:M);
outputData = data(:,M+1:end);
Generate the FIS structure.
fis = genfis(inputData,outputData,opt);
The fuzzy system
fiscontains one fuzzy rule for each cluster, and each input and output variable has one membership function per cluster. For more information, seegenfisandgenfisOptions.
References
[1] Bezdek, James C. Pattern Recognition with Fuzzy Objective Function Algorithms. Boston, MA: Springer US, 1981. https://doi.org/10.1007/978-1-4757-0450-1.
[2] Gustafson, Donald, and William Kessel. “Fuzzy Clustering with a Fuzzy Covariance Matrix.” In 1978 IEEE Conference on Decision and Control Including the 17th Symposium on Adaptive Processes, 761–66. San Diego, CA, USA: IEEE, 1978. https://doi.org/10.1109/CDC.1978.268028.
[3] Gath, I., and A.B. Geva. “Unsupervised Optimal Fuzzy Clustering.” IEEE Transactions on Pattern Analysis and Machine Intelligence 11, no. 7 (July 1989): 773–80. https://doi.org/10.1109/34.192473.
[4] Xie, X.L., and G. Beni. “A Validity Measure for Fuzzy Clustering.” IEEE Transactions on Pattern Analysis and Machine Intelligence 13, no. 8 (August 1991): 841–47. https://doi.org/10.1109/CDC.1978.268028.