Main Content

plotTrajectory

Plot set of trajectories in trajectory plotter

Description

example

plotTrajectory(trajPlotter,trajCoordList) plots trajectories specified by trajCoordList via the trajectory plotter on a theater plot.

Examples

collapse all

Define the coordinates for three trajectories.

coordinates1 = [(1:10)' (2:11)' (11:-1:2)'];
coordinates2 = coordinates1 + 1;
coordinates3 = coordinates1 + 2;

Create a theaterPlot object, set the view angles, and create a trajectoryPlotter object.

tp = theaterPlot;
view(14,50)
trajPlotter = trajectoryPlotter(tp,DisplayName="Trajectories");

Plot the three trajectories.

plotTrajectory(trajPlotter,{coordinates1,coordinates2,coordinates3})
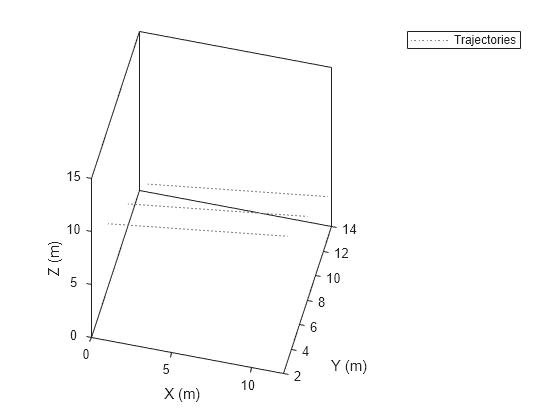
Figure contains an axes object. The axes object with xlabel X (m), ylabel Y (m) contains an object of type line. This object represents Trajectories.

This example shows how to create an animation of a platform moving on a trajectory.

First, create a trackingScenario and add waypoints for a trajectory.

ts = trackingScenario;
height = 100;
d = 1;
wayPoints = [ ...
    -30   -25   height;
    -30    25-d height;
    -30+d  25   height;
    -10-d  25   height;
    -10    25-d height;
    -10   -25+d height;
    -10+d -25   height;
    10-d -25   height;
    10   -25+d height;
    10    25-d height;
    10+d  25   height;
    30-d  25   height;
    30    25-d height;
    30   -25+d height;
    30   -25   height];

Specify a time for each waypoint.

elapsedTime = linspace(0,10,size(wayPoints,1));

Next, create a platform in the tracking scenario and add trajectory information using the trajectory method.

target = platform(ts);
traj = waypointTrajectory('Waypoints',wayPoints,'TimeOfArrival',elapsedTime);
target.Trajectory = traj;

Record the tracking scenario to retrieve the platform's trajectory.

r = record(ts);
pposes = [r(:).Poses];
pposition = vertcat(pposes.Position);

Create a theater plot to display the recorded trajectory.

tp = theaterPlot('XLim',[-40 40],'YLim',[-40 40]);
trajPlotter = trajectoryPlotter(tp,'DisplayName','Trajectory');
plotTrajectory(trajPlotter,{pposition})

Figure contains an axes object. The axes object with xlabel X (m), ylabel Y (m) contains an object of type line. This object represents Trajectory.

Animate using the platformPlotter.

restart(ts);
trajPlotter = platformPlotter(tp,'DisplayName','Platform');

while advance(ts)
    p = pose(target,'true');
    plotPlatform(trajPlotter, p.Position);
    pause(0.1)
    
end

Figure contains an axes object. The axes object with xlabel X (m), ylabel Y (m) contains 2 objects of type line. One or more of the lines displays its values using only markers These objects represent Trajectory, Platform.

This animation loops through all the generated plots.

Input Arguments

collapse all

Trajectory plotter, specified as a trajectoryPlotter object.

Coordinates of the trajectories to show, specified as an N-element cell array, where N is the number of trajectories. Each cell element, representing a trajectory, contains an M-by-3 matrices, where M is the number of points in the trajectory. The matrices in different cells can have a different number of rows. The first, second, and third columns of each matrix correspond to the x-, y-, and z-coordinates of the corresponding trajectory.

Example: coordList = {[1 2 3; 4 5 6; 7,8,9];[4 2 1; 4 3 1];[4 4 4; 3 1 2; 9 9 9; 1 0 2]} specifies three different trajectories.

Version History

Introduced in R2018b