plotSurface
Description
Examples
Create a tracking scenario.
scene = trackingScenario;
Define the terrain and boundaries of two surfaces and add the two surfaces to the tracking scenario.
terrain1 = randi(100,4,5);
terrain2 = randi(100,3,3);

boundary1 = [0 100;
    0 100-eps];
boundary2 = [0 100;
    100 200];

s1 = groundSurface(scene,Terrain=terrain1,Boundary=boundary1);
s2 = groundSurface(scene,Terrain=terrain2,Boundary=boundary2);
Obtain the plotter data by using the surfacePlotterData function.
plotterData = surfacePlotterData(scene.SurfaceManager)
plotterData=1×2 struct array with fields:
    X
    Y
    Z
    C
Create a theaterPlot object and specify its axial limits.
tp = theaterPlot(ZLimits=[-50 150],YLimits=[-50 250],ZLimits=[-100 100]);
Create a surface plotter.
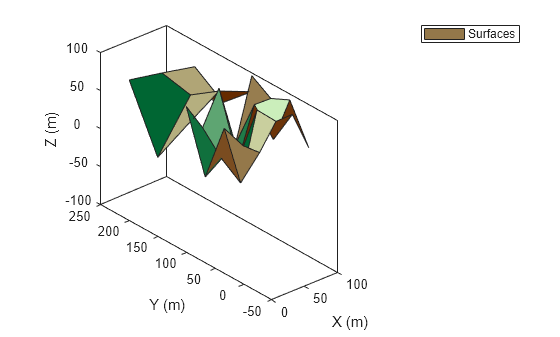
splotter = surfacePlotter(tp,DisplayName="Surfaces");Plot surfaces in the theater plot. Change the view angles for better visualization.
plotSurface(splotter,plotterData)
view(-41,29)

Input Arguments
Surface plotter object, created by the surfacePlotter function.
Plot data, specified as an S-element array of structures, where
S is the number of surfaces. You can directly create this argument
by using the surfacePlotterData function. To create this argument manually, specify
each structure with these fields.
| Field Name | Description |
|---|---|
X | Domain of the surface in the x-direction, specified as an M-element real-valued vector. M is the number of x-coordinates for defining the terrain of the surface. The values for the elements in the vector must monotonically increase. |
Y | Domain of the surface in the y-direction, specified as an N-element real-valued vector. N is the number of y-coordinates for defining the terrain of the surface. The values for the elements in the vector must monotonically increase. |
Z | Height values of the surface, specified as an
N-by-M real-valued matrix.
N is the number of elements in the Y
field, and M is the number of elements in the
X field. |
C | Color for vertices in the terrain of the surface, specified as an
N-by-M-by-3 matrix of RGB triplets.
N is the number of elements in the Y
field, and M is the number of elements in the
X field. The plotSurface function
determines the color of a surface patch based on the color of its first
vertex. |
Version History
Introduced in R2022b
See Also
surfacePlotterData | surfacePlotter | theaterPlot | SurfaceManager (Radar Toolbox)
MATLAB Command
You clicked a link that corresponds to this MATLAB command:
Run the command by entering it in the MATLAB Command Window. Web browsers do not support MATLAB commands.
웹사이트 선택
번역된 콘텐츠를 보고 지역별 이벤트와 혜택을 살펴보려면 웹사이트를 선택하십시오. 현재 계신 지역에 따라 다음 웹사이트를 권장합니다:
또한 다음 목록에서 웹사이트를 선택하실 수도 있습니다.
사이트 성능 최적화 방법
최고의 사이트 성능을 위해 중국 사이트(중국어 또는 영어)를 선택하십시오. 현재 계신 지역에서는 다른 국가의 MathWorks 사이트 방문이 최적화되지 않았습니다.
미주
- América Latina (Español)
- Canada (English)
- United States (English)
유럽
- Belgium (English)
- Denmark (English)
- Deutschland (Deutsch)
- España (Español)
- Finland (English)
- France (Français)
- Ireland (English)
- Italia (Italiano)
- Luxembourg (English)
- Netherlands (English)
- Norway (English)
- Österreich (Deutsch)
- Portugal (English)
- Sweden (English)
- Switzerland
- United Kingdom (English)