Main Content

rcsSignature

Radar cross-section pattern

Description

rcsSignature creates a radar cross-section (RCS) signature object. You can use this object to model an angle-dependent and frequency-dependent radar cross-section pattern. The radar cross-section determines the intensity of reflected radar signal power from a target. The object models both polarized and non-polarized signals. The object support several Swerling fluctuation models.

Creation

Description

rcssig = rcsSignature creates an rcsSignature object with default property values.

example

rcssig = rcsSignature(Name,Value) sets object properties using one or more Name,Value pair arguments. Name is a property name and Value is the corresponding value. Name must appear inside single quotes (''). You can specify several name-value pair arguments in any order as Name1,Value1,...,NameN,ValueN. Any unspecified properties take default values.

Note

You can only set property values of rcsSignature when constructing the object. The property values are not changeable after construction.

Properties

expand all

To enable polarization, set this property to true to enable polarization. Set this property to false to ignore polarization.

Data Types: logical

Polarization scattering matrix form, specified as 'Full' or 'Symmetric'.

  • 'Full' makes no assumptions about the cross-polarization terms and the polarization matrix components must all be specified (ShhPattern, SvvPattern, ShvPattern, SvhPattern). When this input method is selected, the ShvPattern and SvhPattern properties are applicable.

  • 'Symmetric' assumes reciprocity (monostatic geometry) and that the cross-polarization terms are equal (ShvPattern = SvhPattern). When this input method is selected, the ShvPattern property is available. The SvhPattern property is not available and is assumed to be equal to the ShvPattern property.

Dependencies

To enable this property, set the EnablePolarization property to true.

Sampled radar cross-section (RCS) pattern, specified as a scalar, a Q-by-P real-valued matrix, or a Q-by-P-by-K real-valued array. The pattern is an array of RCS values defined on a grid of elevation angles, azimuth angles, and frequencies. Azimuth and elevation are defined in the body frame of the target.

  • Q is the number of RCS samples in elevation.

  • P is the number of RCS samples in azimuth.

  • K is the number of RCS samples in frequency.

Q, P, and K usually match the length of the vectors defined in the Elevation, Azimuth, and Frequency properties, respectively, with these exceptions:

  • To model an RCS pattern for an elevation cut (constant azimuth), you can specify the RCS pattern as a Q-by-1 vector or a 1-by-Q-by-K matrix. Then, the azimuth vector specified in the Azimuth property must have length 2.

  • To model an RCS pattern for an azimuth cut (constant elevation), you can specify the RCS pattern as a 1-by-P vector or a 1-by-P-by-K matrix. Then, the elevation vector specified in the Elevation property must have length 2.

  • To model an RCS pattern for one frequency, you can specify the RCS pattern as a Q-by-P matrix. Then, the frequency vector specified in the Frequency property must have length 2.

Example: [10,0;0,-5]

Data Types: double

Polarization scattering matrix co-polarized HH component, where HH represents horizontal transmission and horizontal reception. Q is the length of the vector in the Elevation property. P is the length of the vector in the Azimuth property. If the pattern is three-dimensional, then K is the length of the vector in the Frequency property.

When defining patterns for azimuth or elevation only cuts, P or Q can equal 1, but the corresponding Azimuth or Elevation property must still be a 2-element vector. In this case, the Azimuth or Elevation property defines the view angles over which the pattern is considered valid for the pattern's dimension with length 1.

Dependencies

To enable this property, set the EnablePolarization property to true.

Data Types: double
Complex Number Support: Yes

Polarization scattering matrix co-polarized VV component, where VV represents vertical transmission and vertical reception. Q is the length of the vector in the Elevation property. P is the length of the vector in the Azimuth property. If the pattern is three-dimensional, then K is the length of the vector in the Frequency property.

When defining patterns for azimuth or elevation only cuts, P or Q can equal 1, but the corresponding Azimuth or Elevation property must still be a 2-element vector. In this case, the Azimuth or Elevation property defines the view angles over which the pattern is considered valid for the pattern's dimension with length 1.

Dependencies

To enable this property, set the EnablePolarization property to true.

Data Types: double
Complex Number Support: Yes

Polarization scattering matrix co-polarized HV component, where HV represents horizontal transmission and vertical reception. Q is the length of the vector in the Elevation property. P is the length of the vector in the Azimuth property. If the pattern is three-dimensional, then K is the length of the vector in the Frequency property.

When defining patterns for azimuth or elevation only cuts, P or Q can equal 1, but the corresponding Azimuth or Elevation property must still be a 2-element vector. In this case, the Azimuth or Elevation property defines the view angles over which the pattern is considered valid for the pattern's dimension with length 1.

Dependencies

To enable this property, set the EnablePolarization property to true.

Data Types: double
Complex Number Support: Yes

Polarization scattering matrix co-polarized HV component, where VH represents vertical transmission and horizontal reception. Q is the length of the vector in the Elevation property. P is the length of the vector in the Azimuth property. If the pattern is three-dimensional, then K is the length of the vector in the Frequency property.

When defining patterns for azimuth or elevation only cuts, P or Q can equal 1, but the corresponding Azimuth or Elevation property must still be a 2-element vector. In this case, the Azimuth or Elevation property defines the view angles over which the pattern is considered valid for the pattern's dimension with length 1.

Dependencies

To enable this property, set the EnablePolarization property to true and the CrossPolarization property to 'Full'.

Data Types: double
Complex Number Support: Yes

Azimuth angles used to define the angular coordinates of each column of the matrix or array, specified by the Pattern property. Specify the azimuth angles as a length-P vector. P must be greater than two. Angle units are in degrees.

When the Pattern property defines an elevation cut, Azimuth must be a 2-element vector defining the minimum and maximum azimuth view angles over which the elevation cut is considered valid.

Example: [-45:0.5:45]

Data Types: double

Elevation angles used to define the coordinates of each row of the matrix or array, specified by the Pattern property. Specify the elevation angles as a length-Q vector. Q must be greater than two. Angle units are in degrees.

When the Pattern property defines an azimuth cut, Elevation must be a 2-element vector defining the minimum and maximum elevation view angles over which the azimuth cut is considered valid.

Example: [-30:0.5:30]

Data Types: double

Frequencies used to define the applicable RCS for each page of the Pattern property, specified as a K-element vector of positive scalars. K is the number of RCS samples in frequency. K must be no less than two. Frequency units are in hertz.

When the Pattern property is a matrix, Frequency must be a 2-element vector defining the minimum and maximum frequencies over which the pattern values are considered valid.

Example: [0:0.1:30]

Data Types: double

Fluctuation models, specified as 'Swerling0', 'Swerling1' or 'Swerling3'. Swerling cases 2 and 4 are not modeled as these are determined how the target is sample, not an inherent target property.

ModelDescription
'Swerling0'The target RCS is assumed to be non-fluctuating. In this case the instantaneous RCS signature value retrieved by the value method is deterministic. This model represents ideal radar targets with an RCS that remains constant in time across the range of aspect angles of interest, e.g., a conducting sphere and various corner reflectors.
'Swerling1'The target is assumed to be made up of many independent scatterers of equal size. This model is typically used to represent aircraft. The instantaneous RCS signature value returned by the value method in this case is a random variable distributed according to the exponential distribution with a mean determined by the Pattern property.
'Swerling3'The target is assumed to have one large dominant scatterer and several small scatterers. The RCS of the dominant scatterer equals 1+sqrt(2) times the sum of the RCS of other scatterers. This model can be used to represent helicopters and propeller driven aircraft. In this case the instantaneous RCS signature's value returned by the value method is a random variable distributed according to the 4th degree chi-square distribution with mean determined by the Pattern property.

Data Types: char | string

Object Functions

valueRadar cross-section at specified angle and frequency
toStructConvert to structure

Examples

collapse all

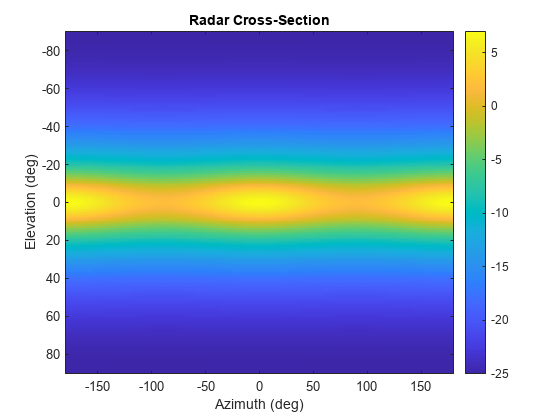
Specify the radar cross-section (RCS) of a triaxial ellipsoid and plot RCS values along an azimuth cut.

Specify the lengths of the axes of the ellipsoid. Units are in meters.

a = 0.15;
b = 0.20;
c = 0.95;

Create an RCS array. Specify the range of azimuth and elevation angles over which RCS is defined. Then, use an analytical model to compute the radar cross-section of the ellipsoid. Create an image of the RCS.

az = [-180:1:180];
el = [-90:1:90];
rcs = rcs_ellipsoid(a,b,c,az,el);
rcsdb = 10*log10(rcs);
imagesc(az,el,rcsdb)
title('Radar Cross-Section')
xlabel('Azimuth (deg)')
ylabel('Elevation (deg)')
colorbar

Figure contains an axes object. The axes object with title Radar Cross-Section, xlabel Azimuth (deg), ylabel Elevation (deg) contains an object of type image.

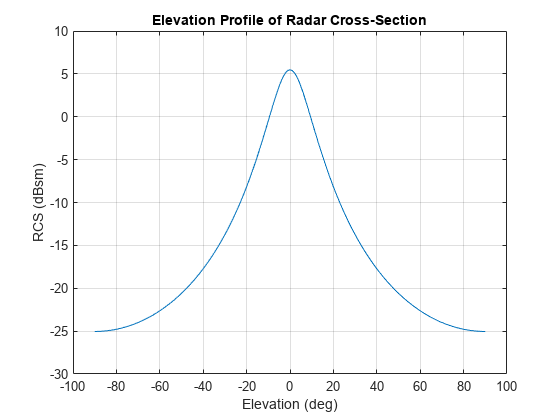
Create an rcsSignature object and plot an elevation cut at 30 azimuth.

rcssig = rcsSignature('Pattern',rcsdb,'Azimuth',az,'Elevation',el,'Frequency',[300e6 300e6]);
rcsdb1 = value(rcssig,30,el,300e6);
plot(el,rcsdb1)
grid
title('Elevation Profile of Radar Cross-Section')
xlabel('Elevation (deg)')
ylabel('RCS (dBsm)')

Figure contains an axes object. The axes object with title Elevation Profile of Radar Cross-Section, xlabel Elevation (deg), ylabel RCS (dBsm) contains an object of type line.

function rcs = rcs_ellipsoid(a,b,c,az,el)
sinaz = sind(az);
cosaz = cosd(az);
sintheta = sind(90 - el);
costheta = cosd(90 - el);
denom = (a^2*(sintheta'.^2)*cosaz.^2 + b^2*(sintheta'.^2)*sinaz.^2 + c^2*(costheta'.^2)*ones(size(cosaz))).^2;
rcs = (pi*a^2*b^2*c^2)./denom;
end

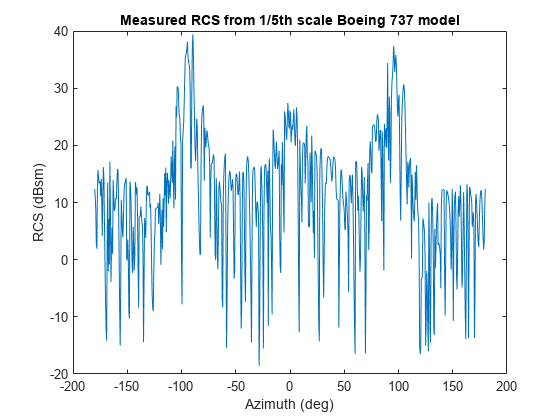
Import the radar cross-section (RCS) measurements of a 1/5th scale Boeing 737. Load the RCS data into an rcsSignature object. Assume the RCS follows a Swerling 1 distribution.

load('RCSSignatureExampleData.mat','boeing737');
rcs = rcsSignature('Pattern',boeing737.RCSdBsm, ...
    'Azimuth', boeing737.Azimuth,'Elevation',boeing737.Elevation, ...
    'Frequency',boeing737.Frequency,'FluctuationModel','Swerling1');

Set the seed of the random number generator for reproducibility of example.

rng(3231)

Plot sample RCS versus azimuth angle.

plot(rcs.Azimuth,rcs.Pattern)
xlabel('Azimuth (deg)'); ylabel('RCS (dBsm)')
title('Measured RCS from 1/5th scale Boeing 737 model')

Figure contains an axes object. The axes object with title Measured RCS from 1/5th scale Boeing 737 model, xlabel Azimuth (deg), ylabel RCS (dBsm) contains an object of type line.

Construct an RCS histogram and display the mean value.

N = 1000;
val = zeros(1,N);
for k = 1:N
    [val(k),expval] = value(rcs,-5,0,800.0e6);
end

Convert to power units.

mean(db2pow(val))
ans = 406.9799
histogram(db2pow(val),50)
xlabel("RCS (dBsm)")
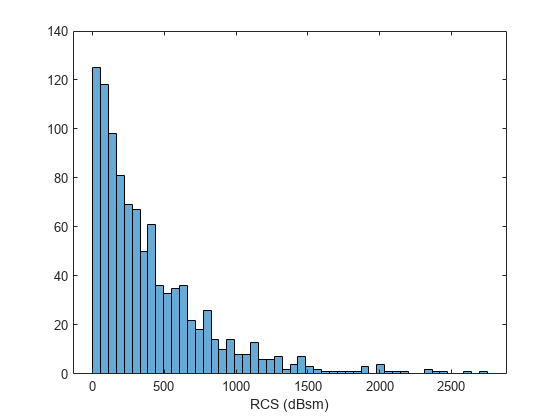
Figure contains an axes object. The axes object with xlabel RCS (dBsm) contains an object of type histogram.

References

[1] Richards, Mark A. Fundamentals of Radar Signal Processing. New York, McGraw-Hill, 2005.

Extended Capabilities

C/C++ Code Generation
Generate C and C++ code using MATLAB® Coder™.

Version History

Introduced in R2018b