fusexcov
Covariance fusion using cross-covariance
Syntax
Description
[
fuses the track states in fusedState,fusedCov] = fusexcov(trackState,trackCov)trackState and their corresponding covariance
matrices trackCov. The function estimates the fused state and
covariance within a Bayesian framework in which the cross-correlation between tracks is
unknown.
[
specifies a cross-covariance factor for the effective correlation coefficient when computing
the cross-covariance.fusedState,fusedCov] = fusexcov(trackState,trackCov,crossCovFactor)
Examples
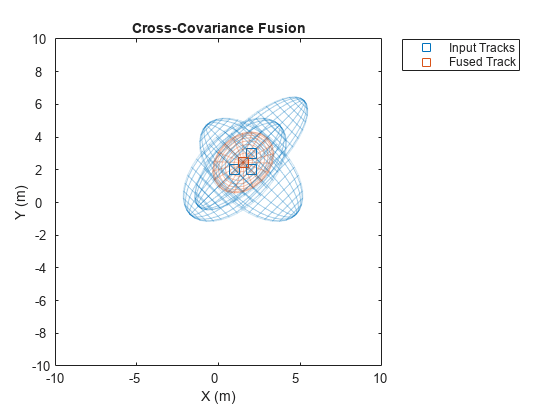
Define a state vector of tracks.
x(:,1) = [1;2;0];
x(:,2) = [2;2;0];
x(:,3) = [2;3;0];
Define the covariance matrices of the tracks.
p(:,:,1) = [10 5 0; 5 10 0;0 0 1];
p(:,:,2) = [10 -5 0; -5 10 0;0 0 1];
p(:,:,3) = [12 9 0; 9 12 0;0 0 1];
Estimate the fused state vector and its covariance.
[fusedState,fusedCov] = fusexcov(x,p);
Use trackPlotter to plot the results.
tPlotter = theaterPlot('XLim',[-10 10],'YLim',[-10 10],'ZLim',[-10 10]);
tPlotter1 = trackPlotter(tPlotter, ...
    'DisplayName','Input Tracks','MarkerEdgeColor',[0.000 0.447 0.741]);
tPlotter2 = trackPlotter(tPlotter, ...
    'DisplayName','Fused Track','MarkerEdgeColor',[0.850 0.325 0.098]);
plotTrack(tPlotter1,x',p)
plotTrack(tPlotter2, fusedState', fusedCov)
title('Cross-Covariance Fusion')
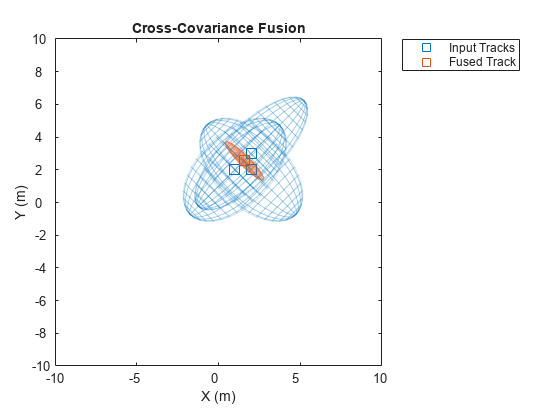
Define a state vector of tracks.
x(:,1) = [1;2;0];
x(:,2) = [2;2;0];
x(:,3) = [2;3;0];
Define the covariance matrices of the tracks.
p(:,:,1) = [10 5 0; 5 10 0;0 0 1];
p(:,:,2) = [10 -5 0; -5 10 0;0 0 1];
p(:,:,3) = [12 9 0; 9 12 0;0 0 1];
Estimate the fused state vector and its covariance. Specify a cross-covariance factor of 0.5.
[fusedState,fusedCov] = fusexcov(x,p,0.5);
Use trackPlotter to plot the results.
tPlotter = theaterPlot('XLim',[-10 10],'YLim',[-10 10],'ZLim',[-10 10]);
tPlotter1 = trackPlotter(tPlotter, ...
    'DisplayName','Input Tracks','MarkerEdgeColor',[0.000 0.447 0.741]);
tPlotter2 = trackPlotter(tPlotter, ...
    'DisplayName','Fused Track','MarkerEdgeColor',[0.850 0.325 0.098]);
plotTrack(tPlotter1,x',p)
plotTrack(tPlotter2, fusedState', fusedCov)
title('Cross-Covariance Fusion')
Input Arguments
Output Arguments
References
[1] Bar-Shalom, Yaakov, and Xiao-Rong Li. Multitarget-multisensor tracking: principles and techniques. Vol. 19. Storrs, CT: YBs, 1995.
[2] Weng, Zhiyuan, and Petar M. Djurić. "A bayesian approach to covariance estimation and data fusion." In 2012 Proceedings of the 20th European Signal Processing Conference , pp. 2352-2356. IEEE, 2012.
[3] Matzka, Stephan, and Richard Altendorfer. "A comparison of track-to-track fusion algorithms for automotive sensor fusion." In Multisensor Fusion and Integration for Intelligent Systems, pp. 69-81. Springer, Berlin, Heidelberg, 2009.
Extended Capabilities
Version History
Introduced in R2018b