parcorr
Sample partial autocorrelation
Syntax
Description
[
returns the sample partial autocorrelation function
(PACF) and associated lags of the input univariate time series data.pacf,lags] = parcorr(y)
PACFTbl = parcorr(Tbl)DataVariable name-value argument. (since R2022a)
[___,
uses any input-argument combination in the previous syntaxes, and returns the
output-argument combination for the corresponding input arguments and the approximate
upper and lower confidence bounds bounds]
= parcorr(___)bounds on the PACF.
[___] = parcorr(___,
uses additional options specified by one or more name-value arguments. For example,
Name=Value)parcorr(Tbl,DataVariable="RGDP",NumLags=10,NumSTD=1.96) returns 10
lags of the sample PACF of the table variable "RGDP" in
Tbl and 95% confidence bounds.
parcorr(___) plots the sample PACF of the input
series with confidence bounds.
parcorr(
plots on the axes specified by ax,___)ax instead of
the current axes (gca). ax can precede any of the input
argument combinations in the previous syntaxes.
[___, plots the sample PACF of the input series and
additionally returns handles to plotted graphics objects. Use elements of
h]
= parcorr(___)h to modify properties of the plot after you create it.
Examples
Compute the PACF of a univariate time series. Input the time series data as a numeric vector.
Load the quarterly real GDP series in Data_GDP.mat. Plot the series, which is stored in the numeric vector Data.
load Data_GDP
plot(Data)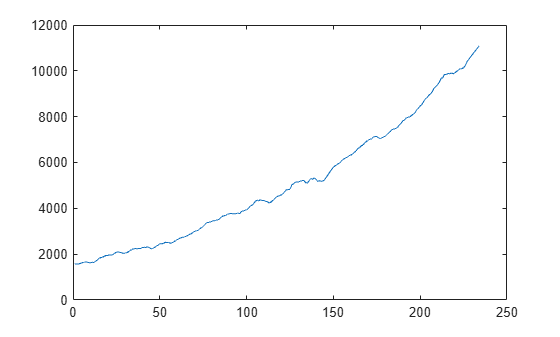
The series exhibits exponential growth.
Compute the returns of the series.
ret = price2ret(Data);
ret is a series of real GDP returns; it has one less observation than the real GDP series.
Compute the PACF of the real GDP returns, and return the associated lags.
[pacf,lags] = parcorr(ret);
[pacf lags]
ans = 21×2

    1.0000         0
    0.3329    1.0000
    0.0828    2.0000
   -0.1205    3.0000
   -0.1080    4.0000
   -0.0869    5.0000
    0.0226    6.0000
   -0.0254    7.0000
   -0.0243    8.0000
    0.0699    9.0000
    0.0143   10.0000
   -0.0390   11.0000
   -0.2032   12.0000
   -0.0513   13.0000
    0.0154   14.0000
      ⋮
Let be the real GDP return at time t. pacf(3) = 0.0828 means that the correlation between and , after adjusting for the linear effects of on , is 0.0828.
Since R2022a
Compute the PACF of a time series, which is one variable in a table.
Load the electricity spot price data set Data_ElectricityPrices.mat, which contains the daily spot prices in the timetable DataTimeTable.
load Data_ElectricityPrices.mat
DataTimeTable.Properties.VariableNames
ans = 1×1 cell array
{'SpotPrice'}
Plot the series.
plot(DataTimeTable.SpotPrice)
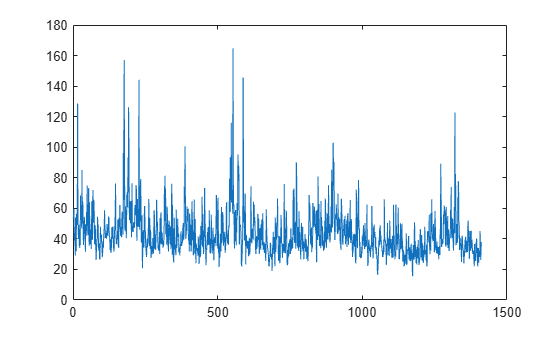
The time series plot does not clearly indicate an exponential trend or unit root.
Compute the PACF of the raw spot price series.
PACFTbl = parcorr(DataTimeTable)
PACFTbl=21×2 table
    Lags      PACF
    ____    ________

      0            1
      1       0.5541
      2      0.10938
      3     0.099833
      4     0.029511
      5     0.038836
      6     0.065892
      7     0.029965
      8     0.034951
      9     0.050091
     10     0.051031
     11     0.033994
     12     0.051877
     13     0.028973
     14     0.047456
     15      0.11895
      ⋮
parcorr returns the results in the table PACFTbl, where variables correspond to the PACF (PACF) and associated lags (Lags).
By default, parcorr computes the PACF of the last variable in the table. To select a variable from an input table, set the DataVariable option.
Since R2022a
Consider the electricity spot prices in Compute PACF of Table Variable.
Load the electricity spot price data set Data_ElectricityPrices.mat. Compute the PACF and return the PACF confidence bounds.
load Data_ElectricityPrices
[PACFTbl,bounds] = parcorr(DataTimeTable)PACFTbl=21×2 table
Lags PACF
____ ________
0 1
1 0.5541
2 0.10938
3 0.099833
4 0.029511
5 0.038836
6 0.065892
7 0.029965
8 0.034951
9 0.050091
10 0.051031
11 0.033994
12 0.051877
13 0.028973
14 0.047456
15 0.11895
⋮
bounds = 2×1

    0.0532
   -0.0532
Assuming the spot prices follow a Gaussian white noise series, an approximate 95.4% confidence interval on the PACF is (-0.0532, 0.0532).
Since R2022a
Load the US quarterly macroeconomic series data Data_USEconModel.mat. Remove all missing values from the timetable of data DataTimeTable by using listwise deletion.
load Data_USEconModel
DataTimeTable = rmmissing(DataTimeTable);
Compute the PACF of the raw effective federal funds rate FEDFUNDS by using the OLS method (the default method when the data does not contain any missing values). Change the name of the PACF variable of the output table to ols.
PACFTbl = parcorr(DataTimeTable,DataVariable="FEDFUNDS",Method="ols");
PACFTbl = renamevars(PACFTbl,"PACF","ols");
Compute the PACF of the raw effective federal funds rate FEDFUNDS by solving the Yule-Walker equations. Store the result as the variable yw in PACFTbl.
PACFTbl.yw = parcorr(DataTimeTable.FEDFUNDS,Method="yule-walker");Compare the PACFs between the methods.
PACFTbl
PACFTbl=21×3 table
    Lags       ols          yw
    ____    _________    _________

      0             1            1
      1       0.92881      0.91502
      2      0.074551     0.061337
      3       0.14949      0.15031
      4      -0.23745     -0.20808
      5      0.073346     0.073911
      6      -0.25854     -0.21128
      7      0.021783     0.018625
      8       0.10817     0.092159
      9       0.16147      0.10987
     10     -0.081344    -0.077452
     11      0.050378     0.034769
     12      0.075574     0.070003
     13      0.026074      0.02403
     14     -0.036989    -0.025924
     15      0.074656     0.048657
      ⋮
Plot the PACFs in the same stem plot.
stem(repmat(PACFTbl.Lags,1,2),PACFTbl{:,["ols" "yw"]},"filled")
title("PACF of Effective Federal Funds Rate")
legend(["OLS" "Yule-Walker"])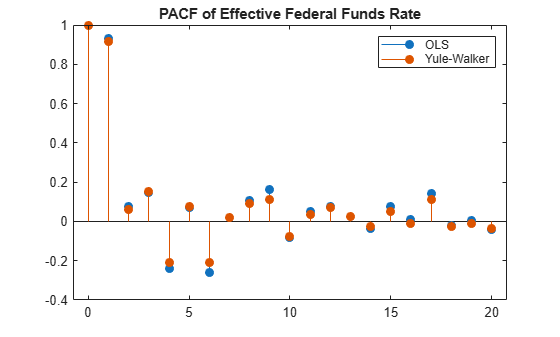
Specify the AR(2) model:
where is Gaussian with mean 0 and variance 1.
rng(1); % For reproducibility
Mdl = arima(AR={0.6 -0.5},Constant=0,Variance=1)
Mdl =
arima with properties:
Description: "ARIMA(2,0,0) Model (Gaussian Distribution)"
SeriesName: "Y"
Distribution: Name = "Gaussian"
P: 2
D: 0
Q: 0
Constant: 0
AR: {0.6 -0.5} at lags [1 2]
SAR: {}
MA: {}
SMA: {}
Seasonality: 0
Beta: [1×0]
Variance: 1
Simulate 1000 observations from Mdl.
y = simulate(Mdl,1000);
Plot the PACF. Specify that the series is an AR(2) process.
parcorr(y,NumAR=2)
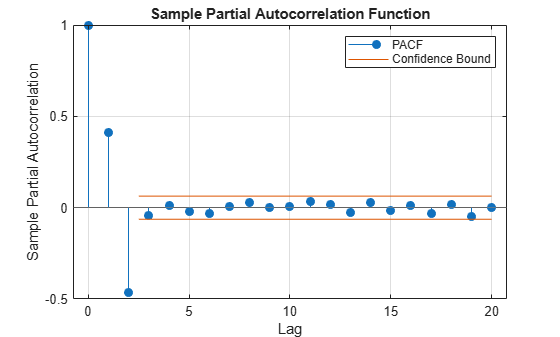
The PACF cuts off after the second lag. This behavior indicates an AR(2) process.
Specify the multiplicative seasonal ARMA model:
where is Gaussian with mean 0 and variance 1.
Mdl = arima(AR={0.75 0.15},SAR={0.9 -0.75 0.5}, ...
    SARLags=[12 24 36],MA=-0.5,Constant=2, ...
    Variance=1);
Simulate data from Mdl.
rng(1);
y = simulate(Mdl,1000);
Plot the default partial autocorrelation function (PACF).
figure
parcorr(y)
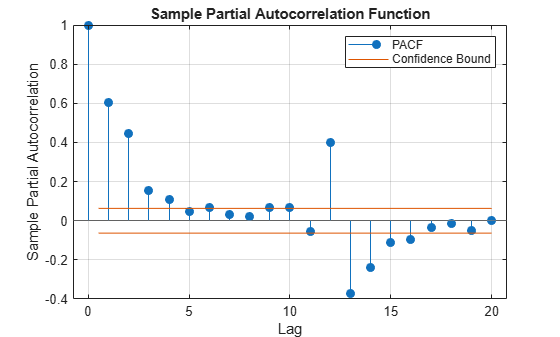
The default correlogram does not display the dependence structure for higher lags.
Plot the PACF for 40 lags.
figure
parcorr(y,NumLags=40)
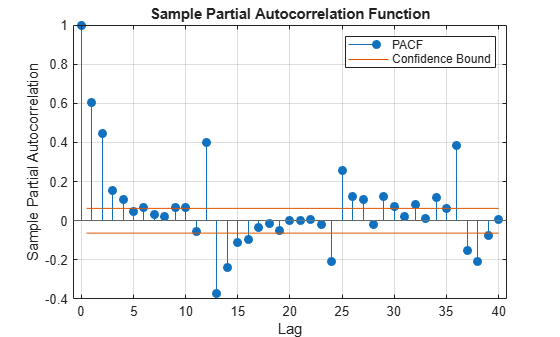
The correlogram shows the larger correlations at lags 12, 24, and 36.
Input Arguments
Name-Value Arguments
Output Arguments
More About
Tips
To plot the PACF without confidence bounds, set
NumSTD=0.
Algorithms
parcorr plots the PACF when you do not request any output or when
you request the fourth output h.
References
[1] Box, George E. P., Gwilym M. Jenkins, and Gregory C. Reinsel. Time Series Analysis: Forecasting and Control. 3rd ed. Englewood Cliffs, NJ: Prentice Hall, 1994.
[2] Hamilton, James D. Time Series Analysis. Princeton, NJ: Princeton University Press, 1994.