Autocorrelation and Partial Autocorrelation
What Are Autocorrelation and Partial Autocorrelation?
Autocorrelation is the linear dependence of a variable with itself at two points in time. For stationary processes, autocorrelation between any two observations depends only on the time lag h between them. Define Cov(yt, yt–h) = γh. Lag-h autocorrelation is given by
The denominator γ0 is the lag 0 covariance, that is, the unconditional variance of the process.
Correlation between two variables can result from a mutual linear dependence on other variables (confounding). Partial autocorrelation is the autocorrelation between yt and yt–h after the removal of any linear dependence on y1, y2, ..., yt–h+1. The partial lag-h autocorrelation is denoted
Theoretical ACF and PACF
The autocorrelation function (ACF) for a time series yt, t = 1,...,N, is the sequence h = 1, 2,...,N – 1. The partial autocorrelation function (PACF) is the sequence h = 1, 2,...,N – 1.
The theoretical ACF and PACF for the AR, MA, and ARMA conditional mean models are known, and are different for each model. These differences among models are important to keep in mind when you select models.
| Conditional Mean Model | ACF Behavior | PACF Behavior |
|---|---|---|
| AR(p) | Tails off gradually | Cuts off after p lags |
| MA(q) | Cuts off after q lags | Tails off gradually |
| ARMA(p,q) | Tails off gradually | Tails off gradually |
Sample ACF and PACF
Sample autocorrelation and sample partial autocorrelation are statistics that estimate the theoretical autocorrelation and partial autocorrelation. Using these qualitative model selection tools, you can compare the sample ACF and PACF of your data against known theoretical autocorrelation functions [1].
For an observed series y1, y2,...,yT, denote the sample mean The sample lag-h autocorrelation is given by
The standard error for testing the significance of a single lag-h autocorrelation, , is approximately
When you use autocorr to plot the
sample autocorrelation function (also known as the correlogram), approximate 95% confidence
intervals are drawn at by default. Optional input arguments let you modify the calculation of the
confidence bounds.
The sample lag-h partial autocorrelation is the estimated
lag-h coefficient in an AR model containing h lags, The standard error for testing the significance of a single
lag-h partial autocorrelation is approximately When you use parcorr to plot the sample
partial autocorrelation function, approximate 95% confidence intervals are drawn at by default. Optional input arguments let you modify the calculation of the
confidence bounds.
Compute Sample ACF and PACF in MATLAB®
This example shows how to compute and plot the sample ACF and PACF of a time series by using the Econometrics Toolbox™ functions autocorr and parcorr, and the Econometric Modeler app.
Generate Synthetic Time Series
Simulate an MA(2) process by filtering a series of 1000 standard Gaussian deviates through the difference equation
rng('default') % For reproducibility
e = randn(1000,1);
y = filter([1 -1 1],1,e);
Plot and Compute ACF
Plot the sample ACF of by passing the simulated time series to autocorr.
autocorr(y)
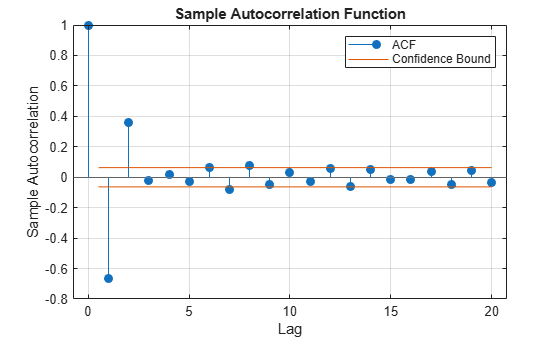
The sample autocorrelation of lags greater than 2 is insignificant.
Compute the sample ACF by calling autocorr again. Return the first output argument.
acf = autocorr(y)
acf = 21×1

    1.0000
   -0.6682
    0.3618
   -0.0208
    0.0146
   -0.0311
    0.0611
   -0.0828
    0.0772
   -0.0493
    0.0323
   -0.0294
    0.0576
   -0.0633
    0.0500
      ⋮
acf(j) is the sample autocorrelation of at lag j – 1.
Plot and Compute PACF
Plot the sample PACF of by passing the simulated time series to parcorr.
parcorr(y)
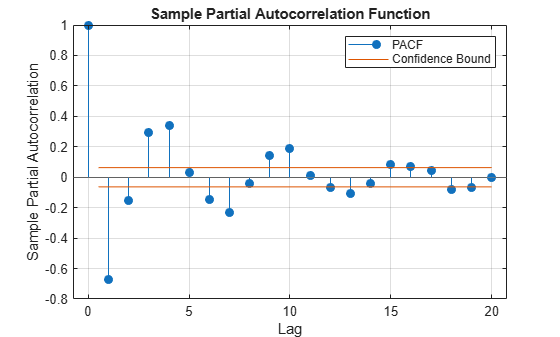
The sample PACF gradually decreases with increasing lag.
Compute the sample PACF by calling parcorr again. Return the first output argument.
pacf = parcorr(y)
pacf = 21×1

    1.0000
   -0.6697
   -0.1541
    0.2929
    0.3421
    0.0314
   -0.1483
   -0.2290
   -0.0394
    0.1419
    0.1857
    0.0095
   -0.0652
   -0.1053
   -0.0382
      ⋮
pacf(j) is the sample partial autocorrelation of at lag j – 1.
The sample ACF and PACF suggest that is an MA(2) process.
Use Econometric Modeler
Open the Econometric Modeler app by entering econometricModeler at the command prompt.
econometricModeler
Load the simulated time series y.
On the Econometric Modeler tab, in the Import section, select Import > Import From Workspace.
In the Import Data dialog box, in the Import? column, select the check box for the
yvariable.Click Import.
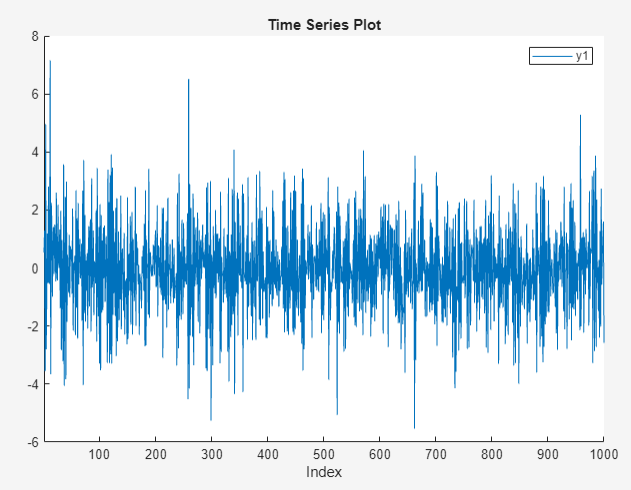
The variable y1 appears in the Data Browser, and its time series plot appears in the Time Series Plot(y1) figure window.
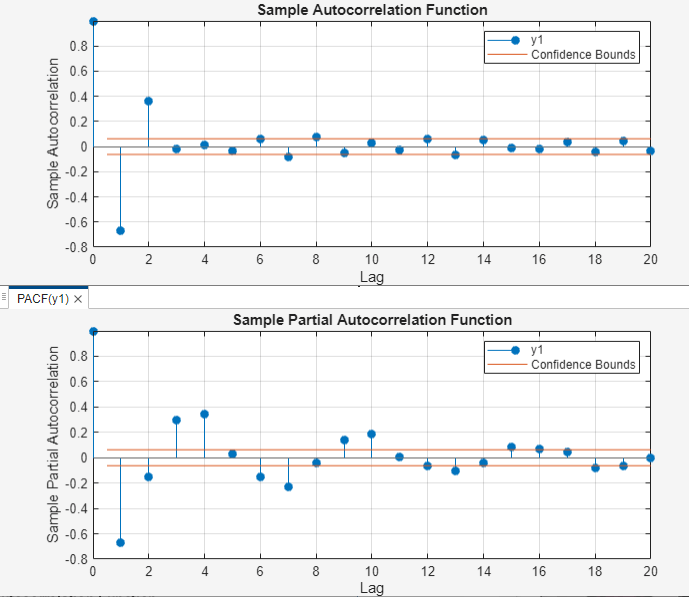
Plot the sample ACF by clicking ACF on the Plots tab.
Plot the sample PACF by clicking PACF on the Plots tab. Position the PACF plot below the ACF plot by dragging the PACF(y1) tab to the lower half of the document.
References
[1] Box, George E. P., Gwilym M. Jenkins, and Gregory C. Reinsel. Time Series Analysis: Forecasting and Control. 3rd ed. Englewood Cliffs, NJ: Prentice Hall, 1994.
See Also
Apps
Functions
Topics
- Detect Serial Correlation Using Econometric Modeler App
- Detect Autocorrelation
- Detect ARCH Effects Using Econometric Modeler App
- Detect ARCH Effects
- Programmatically Select ARIMA Model for Time Series Using Box-Jenkins Methodology
- What Are Autoregressive (AR) Models?
- What Are Moving Average (MA) Models?
- What Are Autoregressive Moving Average (ARMA) Models?