plotwb
R2026b(To be removed) Plot Hinton diagram of weight and bias values
plotwb will be removed in a future release. For more information,
see Transition Legacy Neural Network Code to dlnetwork Workflows.
For advice on updating your code, see Version History.
Syntax
plotwb(net)

plotwb(IW,LW,B)

plotwb(...,'toLayers',toLayers)

plotwb(...,'fromInputs',fromInputs)

plotwb(...,'fromLayers',fromLayers)

plotwb(...,'root',root)
Description
plotwb(net) takes a neural network and plots all its weights and
biases.
plotwb(IW,LW,B) takes a neural networks input weights, layer
weights and biases and plots them.
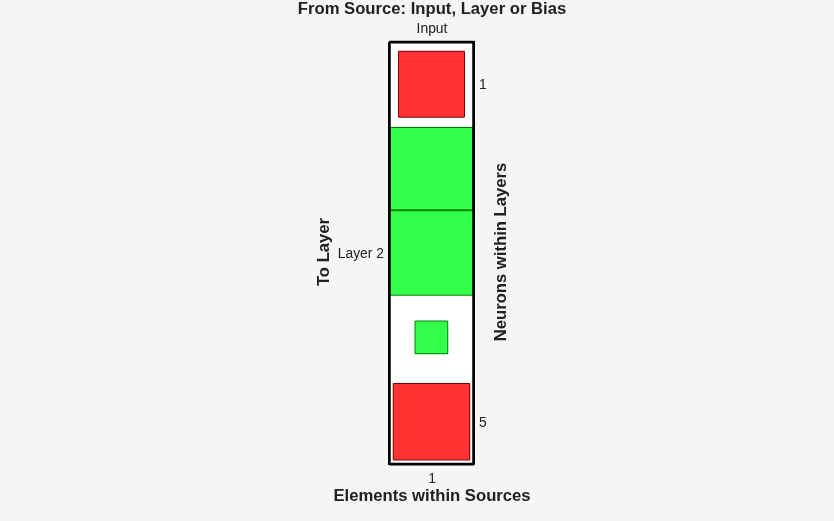
plotwb(...,'toLayers',toLayers) optionally defines which
destination layers whose input weights, layer weights and biases will be plotted.
plotwb(...,'fromInputs',fromInputs) optionally defines which
inputs will have their weights plotted.
plotwb(...,'fromLayers',fromLayers) optionally defines which
layers will have weights coming from them plotted.
plotwb(...,'root',root) optionally defines the root used to scale
the weight/bias patch sizes. The default is 2, which makes the 2-dimensional patch sizes
scale directly with absolute weight and bias sizes. Larger values of root magnify the
relative patch sizes of smaller weights and biases, making differences in smaller values
easier to see.
Examples
Plot Weights and Biases
Here a cascade-forward network is configured for particular data and its weights and biases are plotted in several ways.
[x,t] = simplefit_dataset;
net = cascadeforwardnet([15 5]);
net = configure(net,x,t);
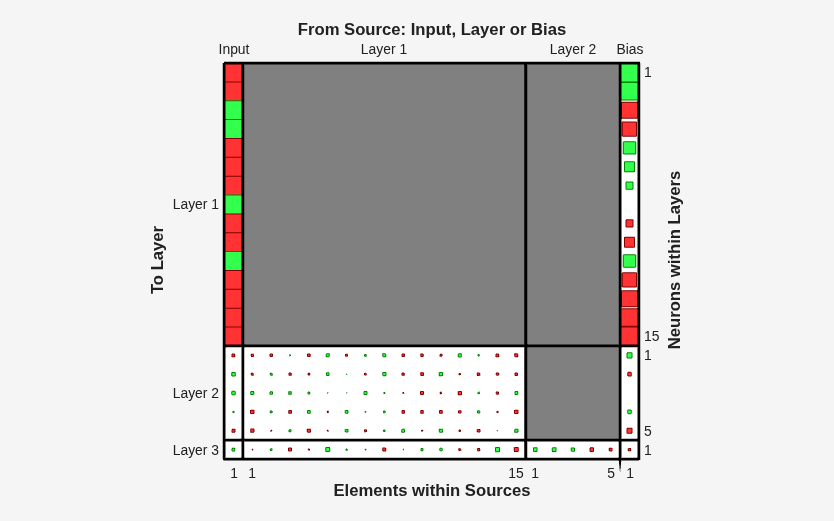
plotwb(net)
plotwb(net,'root',3)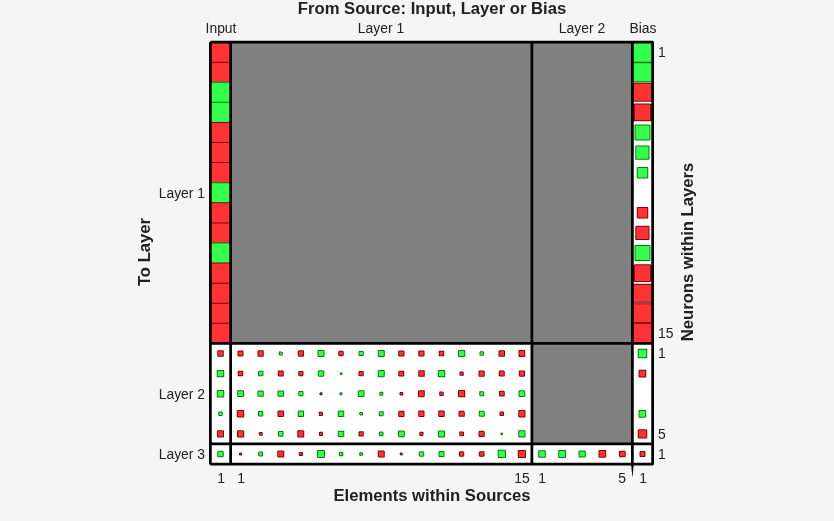
plotwb(net,'root',4)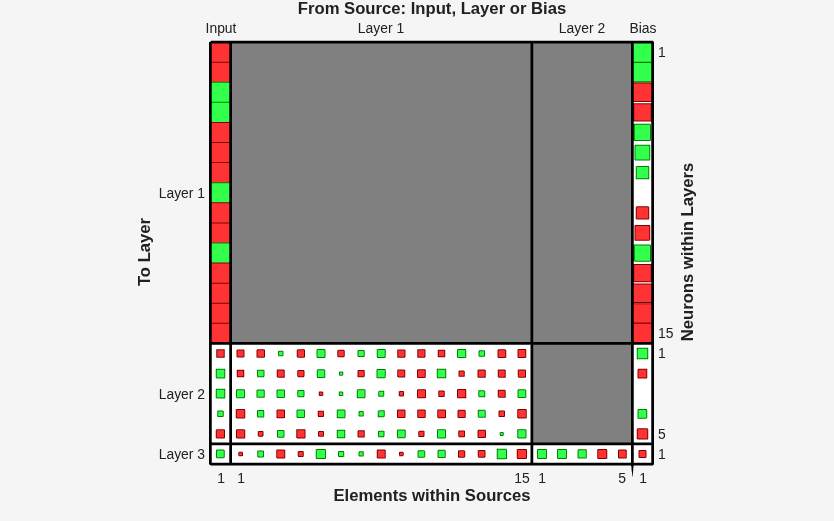
plotwb(net,'toLayers',2)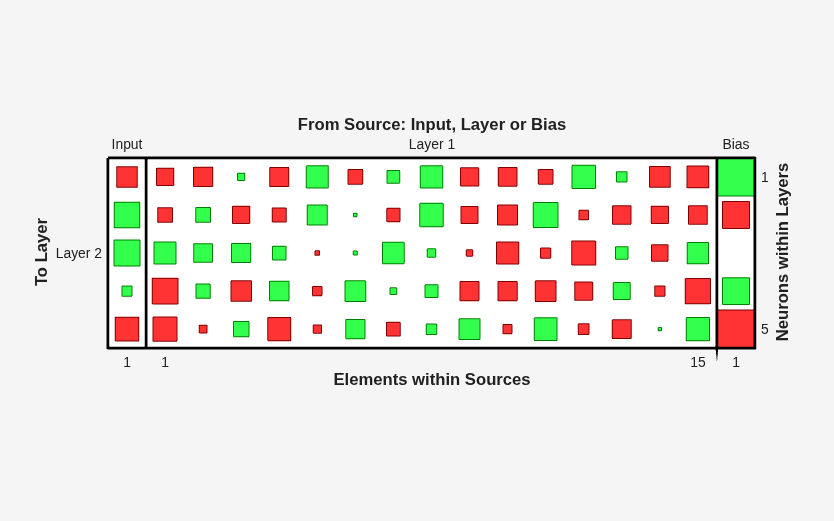
plotwb(net,'fromLayers',1)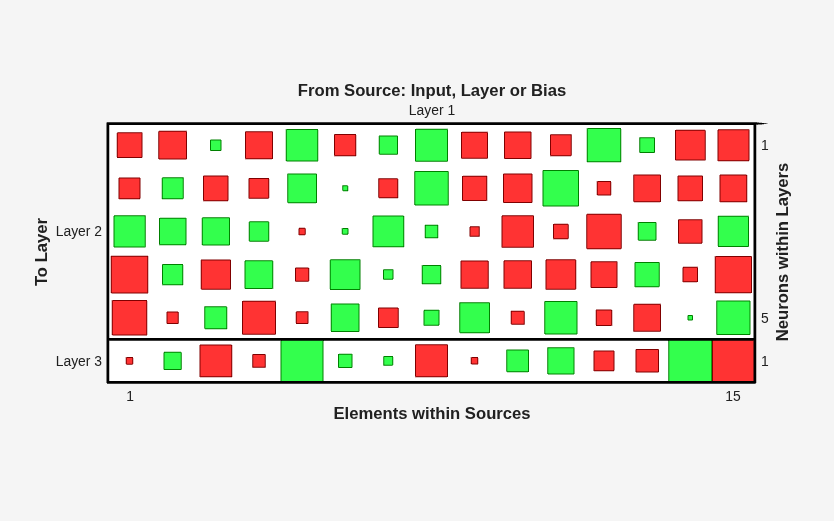
plotwb(net,'toLayers',2,'fromInputs',1)
Version History
Introduced in R2010bSee Also
Time Series
Modeler | fitrnet (Statistics and Machine Learning Toolbox) | fitcnet (Statistics and Machine Learning Toolbox) | trainnet | trainingOptions | dlnetwork

