Main Content

plotsompos

Plot self-organizing map weight positions

Syntax

plotsompos(net)
plotsompos(net,inputs)

Description

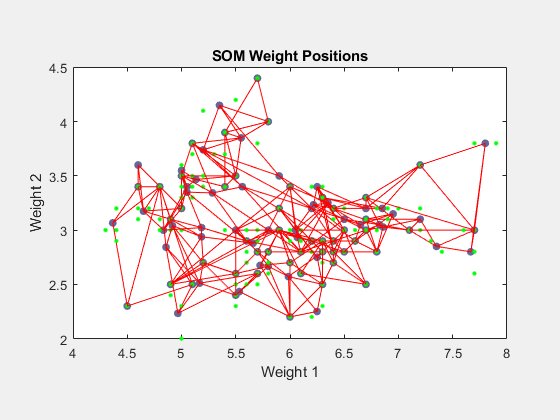
plotsompos(net) plots the input vectors as green dots and shows how the SOM classifies the input space by showing blue-gray dots for each neuron’s weight vector and connecting neighboring neurons with red lines.

plotsompos(net,inputs) plots the input data alongside the weights.

Examples

Plot SOM Weight Positions

x = iris_dataset;
net = selforgmap([10 10]);
net = train(net,x);
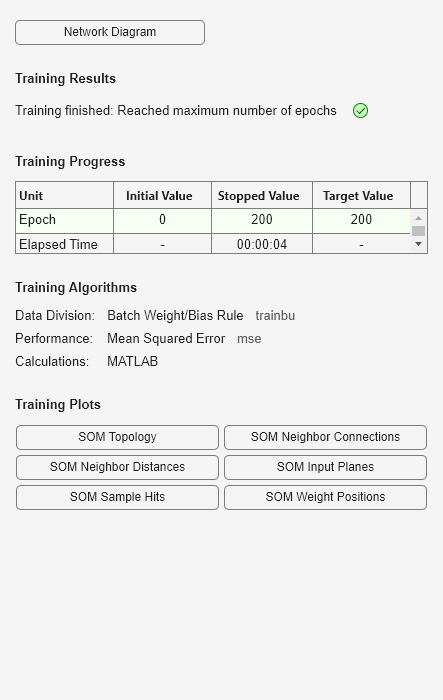
Figure Neural Network Training (05-Sep-2024 18:40:57) contains an object of type uigridlayout.

plotsompos(net,x)

Figure SOM Weight Positions (plotsompos) contains an axes object. The axes object with title SOM Weight Positions, xlabel Weight 1, ylabel Weight 2 contains 3 objects of type line. One or more of the lines displays its values using only markers

Version History

Introduced in R2008a

Go to top of page