plotsomnd
자기 조직화 맵 이웃 거리 플로팅
구문
plotsomnd(net)
설명
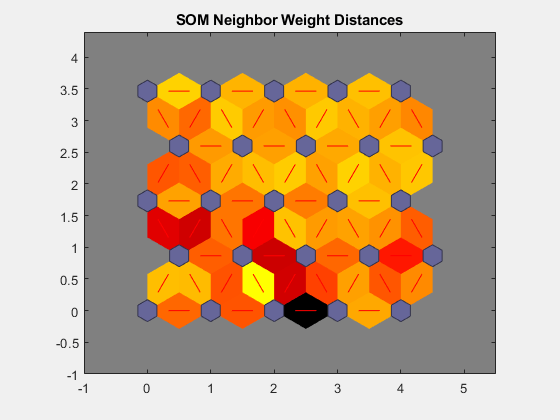
plotsomnd(net)은 SOM 계층을 플로팅하여 뉴런을 회청색 패치로 표시하고 직접 이웃 관계를 빨간색 선으로 표시합니다. 이웃 패치는 각 뉴런의 가중치 벡터가 이웃에 얼마나 가까운지 보여주기 위해 검은색부터 노란색까지의 색으로 표시됩니다.
이 플롯은 SOM 신경망에 대해 hextop 위상과 gridtop 위상을 지원하지만 tritop 또는 randtop는 지원하지 않습니다.
예제
SOM 이웃 거리 플로팅하기
x = iris_dataset;
net = selforgmap([5 5]);
net = train(net,x);

plotsomnd(net)

버전 내역
R2008a에 개발됨