plotsom
R2026b(To be removed) Plot self-organizing map
plotsom will be removed in a future release. For more information,
see Transition Legacy Neural Network Code to dlnetwork Workflows.
For advice on updating your code, see Version History.
Syntax
plotsom(pos)

plotsom(W,D,ND)
Description
plotsom(pos) takes one argument,
POS |
|
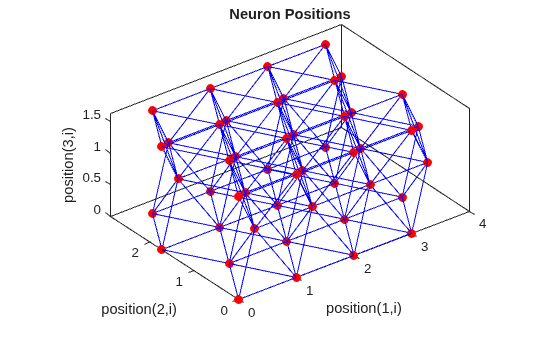
and plots the neuron positions with red dots, linking the neurons within a Euclidean distance of 1.
plotsom(W,D,ND) takes three arguments,
W |
|
D |
|
ND | Neighborhood distance (default = 1) |
and plots the neuron’s weight vectors with connections between weight vectors whose neurons are within a distance of 1.
Examples
Plot Self-Organizing Maps
These examples generate plots of various layer topologies.
pos = hextop([5 6]);
plotsom(pos)
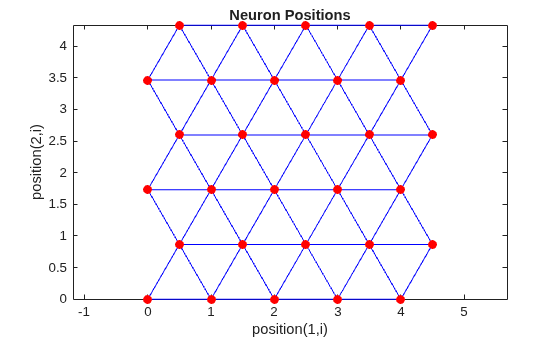
pos = gridtop([4 5]);
plotsom(pos)
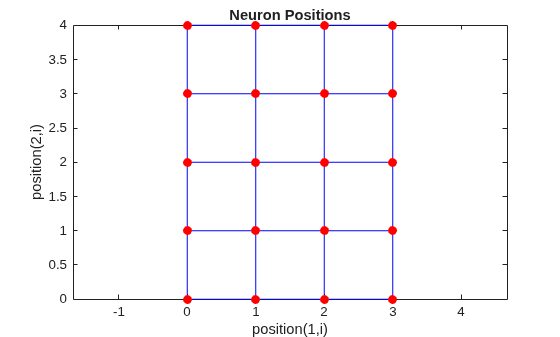
pos = randtop([18 12]);
plotsom(pos)
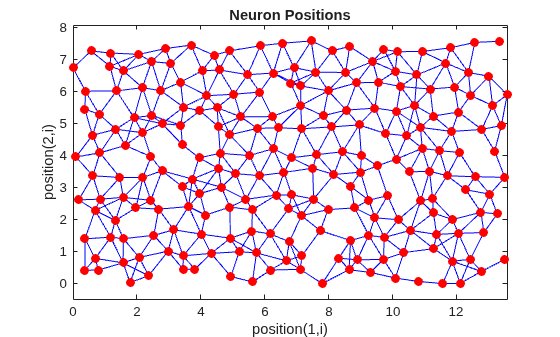
pos = gridtop([4 5 2]);
plotsom(pos)
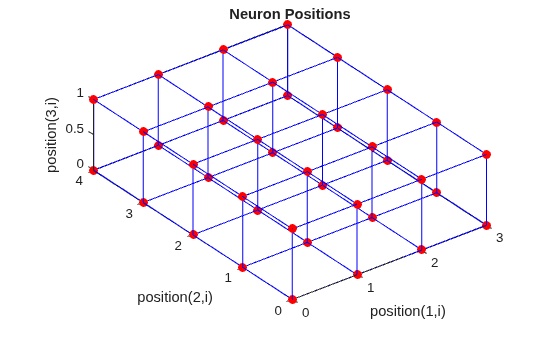
pos = hextop([4 4 3]);
plotsom(pos)
Version History
Introduced before R2006aSee Also
Time Series
Modeler | fitrnet (Statistics and Machine Learning Toolbox) | fitcnet (Statistics and Machine Learning Toolbox) | trainnet | trainingOptions | dlnetwork

