주요 콘텐츠

plotsom

자기 조직화 맵 플로팅

구문

plotsom(pos)
plotsom(W,D,ND)

설명

plotsom(pos)는 다음 하나의 인수를 받습니다.

POS

N차원 뉴런 위치 S개로 구성된 N×S 행렬

그리고 뉴런 위치를 빨간색 점으로 플로팅하고 유클리드 거리 1 내에 있는 뉴런을 연결합니다.

plotsom(W,D,ND)는 다음과 같은 3개의 인수를 받습니다.

W

S×R 가중치 행렬

D

S×S 거리 행렬

ND

이웃 거리(디폴트 값 = 1)

그리고 뉴런이 거리 1 내에 있는 가중 벡터 간의 연결을 사용하여 뉴런의 가중 벡터를 플로팅합니다.

예제

자기 조직화 맵 플로팅하기

이 예제에서는 다양한 계층 위상의 플롯을 생성합니다.

pos = hextop([5 6]); 
plotsom(pos)
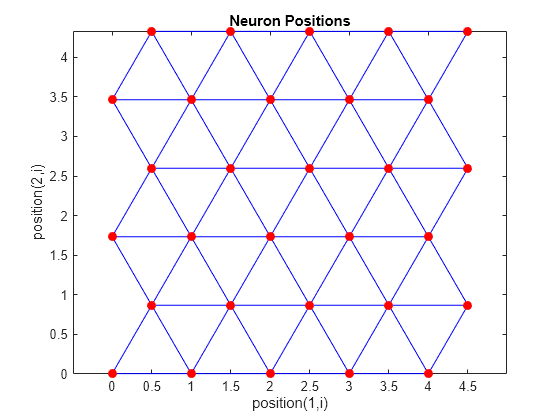
Figure contains an axes object. The axes object with title Neuron Positions, xlabel position(1,i), ylabel position(2,i) contains 2 objects of type line. One or more of the lines displays its values using only markers

pos = gridtop([4 5]); 
plotsom(pos)

Figure contains an axes object. The axes object with title Neuron Positions, xlabel position(1,i), ylabel position(2,i) contains 2 objects of type line. One or more of the lines displays its values using only markers

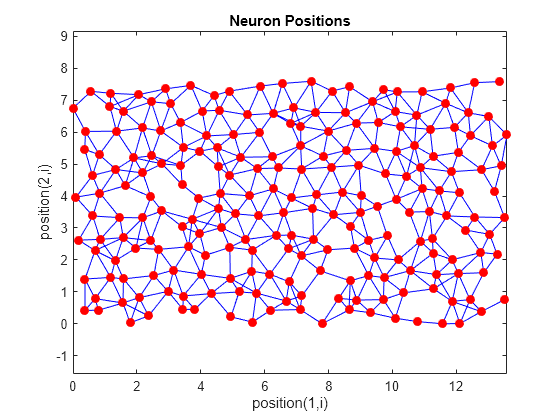
pos = randtop([18 12]); 
plotsom(pos)

Figure contains an axes object. The axes object with title Neuron Positions, xlabel position(1,i), ylabel position(2,i) contains 2 objects of type line. One or more of the lines displays its values using only markers

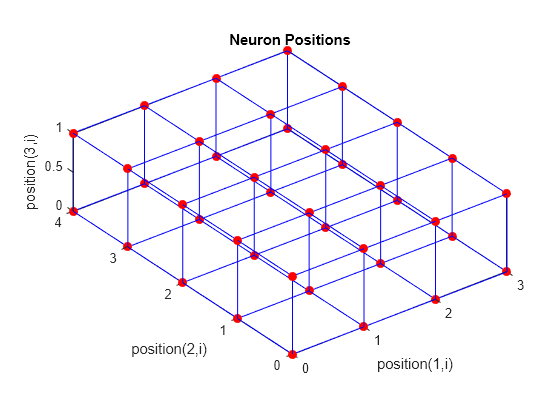
pos = gridtop([4 5 2]); 
plotsom(pos)

Figure contains an axes object. The axes object with title Neuron Positions, xlabel position(1,i), ylabel position(2,i) contains 2 objects of type line. One or more of the lines displays its values using only markers

pos = hextop([4 4 3]); 
plotsom(pos)

Figure contains an axes object. The axes object with title Neuron Positions, xlabel position(1,i), ylabel position(2,i) contains 2 objects of type line. One or more of the lines displays its values using only markers

계층의 가중 벡터를 그 벡터가 매핑하는 입력 벡터를 사용하여 플로팅하는 예제는 plotsompos를 참조하십시오.

버전 내역

R2006a 이전에 개발됨

참고 항목