Numeric Values of Frequency-Domain Characteristics of SISO Model
This example shows how to obtain numeric values of several frequency-domain characteristics of a SISO dynamic system model, including the peak gain, dc gain, system bandwidth, and the frequencies at which the system gain crosses a specified frequency.
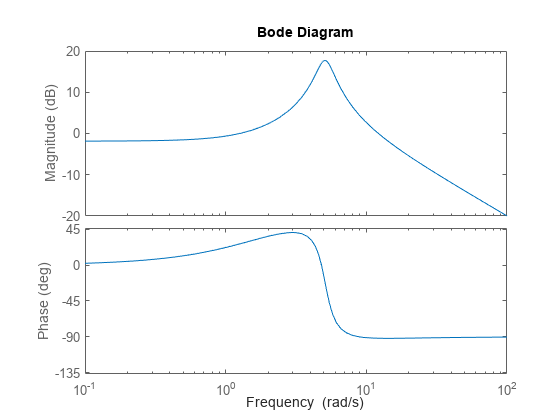
Create a transfer function model and plot its frequency response.
H = tf([10,21],[1,1.4,26]);
bodeplot(H)

Plotting the frequency response gives a rough idea of the frequency-domain characteristics of the system. H includes a pronounced resonant peak, and rolls off at 20 dB/decade at high frequency. It is often desirable to obtain specific numeric values for such characteristics.
Calculate the peak gain and the frequency of the resonance.
[gpeak,fpeak] = getPeakGain(H);
gpeak_dB = mag2db(gpeak)
gpeak_dB =
17.7596
getPeakGain returns both the peak location fpeak and the peak gain gpeak in absolute units. Using mag2db to convert gpeak to decibels shows that the gain peaks at almost 18 dB.
Find the band within which the system gain exceeds 0 dB, or 1 in absolute units.
wc = getGainCrossover(H,1)
wc = 2×1

    1.2582
   12.1843
getGainCrossover returns a vector of frequencies at which the system response crosses the specified gain. The resulting wc vector shows that the system gain exceeds 0 dB between about 1.3 and 12.2 rad/s.
Find the dc gain of H.
The Bode response plot shows that the gain of H tends toward a finite value as the frequency approaches zero. The dcgain command finds this value in absolute units.
k = dcgain(H);
Find the frequency at which the response of H rolls off to –10 dB relative to its dc value.
fb = bandwidth(H,-10);
bandwidth returns the first frequency at which the system response drops below the dc gain by the specified value in dB.
See Also
getPeakGain | getGainCrossover | bandwidth