mil188qammod
MIL-STD-188-110 B/C standard-specific quadrature amplitude modulation (QAM)
Description
performs QAM modulation on the input signal, y
= mil188qammod(x
,M
)x
, in accordance
with MIL-STD-188-110 and the modulation order, M
. For more
information, see MIL-STD-188-110.
specifies options using one or more name-value pair arguments. For example,
y
= mil188qammod(x
,M
,Name,Value
)'OutputDataType','double'
specifies the desired output data
type as double. Specify name-value pair arguments after all other input
arguments.
Examples
Apply 32-QAM to Data per MIL-STD-188-110C
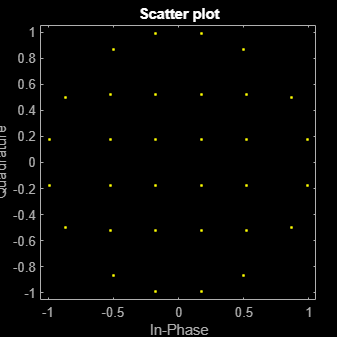
Modulate data using 32-QAM as specified in the MIL-188-110C standard. Display the result using a scatter plot.
Set M to 32 and create a data vector containing all possible symbols.
M = 32; x = (0:M-1);
Modulate the data using QAM as specified in MIL-STD-188-110C.
y = mil188qammod(x,M);
Display the constellation as a scatter plot.
scatterplot(y)
Normalize 16-QAM Modulated MIL-STD-188-110B Signal by Average Power
Modulate data using 16-QAM as specified in the MIL-STD-188-110B standard. Normalize the modulator output so that it has an average signal power of 1 W.
Set M and generate random data.
M = 16; x = randi([0 M-1],1e5,1);
Modulate the data applying 16-QAM as specified in MIL-STD-188-110B. Using name-value pairs, set the unit average power to true
and enable the constellation plot.
y = mil188qammod(x,M,'UnitAveragePower',true,'PlotConstellation',true);
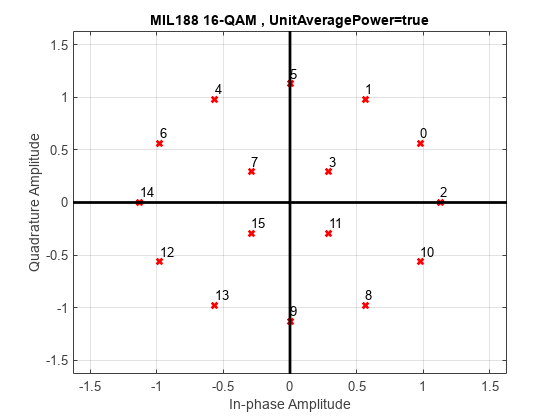
Verify that the signal has approximately unit average power.
avgPow = mean(abs(y).^2)
avgPow = 1.0012
Apply 64-QAM MIL-STD-188-110B Modulation to Bit Data
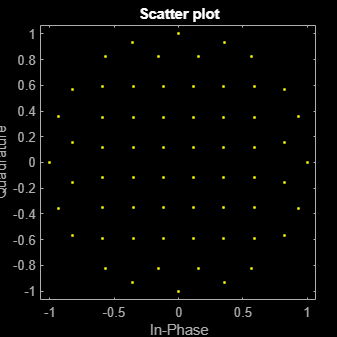
Modulate a sequence of bits using 64-QAM as specified by MIL-STD188-110B. Display the constellation.
Set the modulation order and generate a sequence of random bits.
M = 64; numBitsPerSym = log2(M); data = randi([0 1],1000*numBitsPerSym,1);
Modulate the data applying 64-QAM as specified by MIL-STD-188-110B, and output constellation symbols of single data type.
y = mil188qammod(data,M,'InputType','bit','OutputDataType','single');
Plot the result constellation using a scatter plot.
scatterplot(y)
Input Arguments
x
— Input signal
scalar | vector | matrix
Input signal, specified as a scalar, vector, or matrix. The elements of x
must be binary values or integers that range from 0 to
(M
– 1), where M
is the
modulation order.
Note
To process input signal as binary elements, set the
'InputType'
value to 'bit'
.
For binary inputs, the number of rows must be an integer multiple of log2(M
). Groups of log2(M
) bits in a column are mapped onto a symbol, with the
first bit representing the MSB and the last bit representing the
LSB.
Data Types: double
| single
| int8
| int16
| int32
| uint8
| uint16
| uint32
| logical
M
— Modulation order
integer
Modulation order, specified as a power of two. The modulation order specifies the total number of points in the signal constellation.
Example: 16
Data Types: double
Name-Value Arguments
Specify optional pairs of arguments as
Name1=Value1,...,NameN=ValueN
, where Name
is
the argument name and Value
is the corresponding value.
Name-value arguments must appear after other arguments, but the order of the
pairs does not matter.
Before R2021a, use commas to separate each name and value, and enclose
Name
in quotes.
Example: y = mil188qammod(data,M,'InputType','bit','OutputDataType','single');
InputType
— Input type
'integer'
(default) | 'bit'
Input type, specified as the comma-separated pair consisting of
'InputType'
and either
'integer'
or 'bit'
. If you
specify 'integer'
, the input signal must consist of
integers from 0 to M
– 1. If you specify
'bit'
, the input signal must contain binary
values, and the number of rows must be an integer multiple of log2(M
).
Data Types: char
| string
OutputDataType
— Output data type
'double'
(default) | 'single'
Output data type, specified as the comma-separated pair consisting of
OutputDataType
and 'double'
or 'single'
.
Data Types: char
| string
UnitAveragePower
— Unit average power flag
false
(default) | true
Unit average power flag, specified as the comma-separated pair
consisting of 'UnitAveragePower'
and a logical
scalar. When this flag is true
, the function scales
the constellation to an average power of 1 watt referenced to 1 ohm.
When this flag is false
, the function scales the
constellation based on specifications in the relevant standard, as
described in [1].
Data Types: logical
PlotConstellation
— Option to plot constellation
false
(default) | true
Option to plot constellation, specified as the comma-separated pair
consisting of 'PlotConstellation'
and a logical
scalar. To plot the constellation, set
PlotConstellation
to
true
.
Data Types: logical
Output Arguments
y
— Modulated signal
scalar | vector | matrix
Modulated signal, returned as a complex scalar, vector, or matrix. The
dimension of the output depends on the specified
InputType
value.
InputType | Dimensions of Output |
---|---|
'integer' | y has the same dimensions as
input x . |
'bit' | The number of rows in y equals
the number of rows in x divided by log2(M ). |
Data Types: double
| single
More About
MIL-STD-188-110
MIL-STD-188-110 is a US Department of Defense standard for HF communications using serial PSK mode of both data and voice signals.
The standard specifies physical layer modulation schemes for tactical and long-haul communications. The modulation scheme specified by the standard is a mix of QAM and APSK. For a detailed description of the modulation scheme, see [1].
References
[1] MIL-STD-188-110B & C: "Interoperability and Performance Standards for Data Modems." Department of Defense Interface Standard, USA.
Extended Capabilities
C/C++ Code Generation
Generate C and C++ code using MATLAB® Coder™.
Version History
Introduced in R2018a
MATLAB 명령
다음 MATLAB 명령에 해당하는 링크를 클릭했습니다.
명령을 실행하려면 MATLAB 명령 창에 입력하십시오. 웹 브라우저는 MATLAB 명령을 지원하지 않습니다.
Select a Web Site
Choose a web site to get translated content where available and see local events and offers. Based on your location, we recommend that you select: .
You can also select a web site from the following list:
How to Get Best Site Performance
Select the China site (in Chinese or English) for best site performance. Other MathWorks country sites are not optimized for visits from your location.
Americas
- América Latina (Español)
- Canada (English)
- United States (English)
Europe
- Belgium (English)
- Denmark (English)
- Deutschland (Deutsch)
- España (Español)
- Finland (English)
- France (Français)
- Ireland (English)
- Italia (Italiano)
- Luxembourg (English)
- Netherlands (English)
- Norway (English)
- Österreich (Deutsch)
- Portugal (English)
- Sweden (English)
- Switzerland
- United Kingdom (English)