spectralDecrease
Spectral decrease for audio signals and auditory spectrograms
Syntax
Description
decrease = spectralDecrease(x,f,Name=Value)
spectralDecrease(___) with no output arguments plots
the spectral decrease. You can specify an input combination from any of the previous syntaxes.
If the input is in the time domain, the spectral decrease is plotted against time.
If the input is in the frequency domain, the spectral decrease is plotted against frame number.
Examples
Read in an audio file and calculate the decrease using default parameters.
[audioIn,fs] = audioread("Counting-16-44p1-mono-15secs.wav");
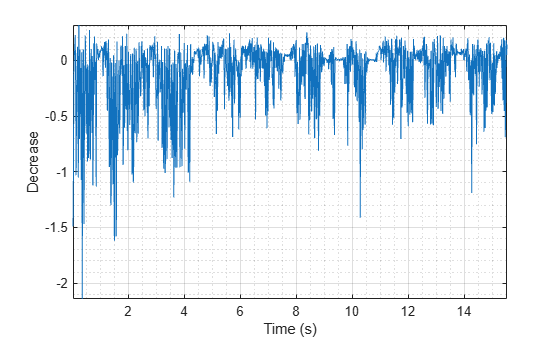
decrease = spectralDecrease(audioIn,fs);Plot the spectral decrease against time.
spectralDecrease(audioIn,fs)
Read in an audio file and then calculate the mel spectrogram using the melSpectrogram function.
[audioIn,fs] = audioread("Counting-16-44p1-mono-15secs.wav");
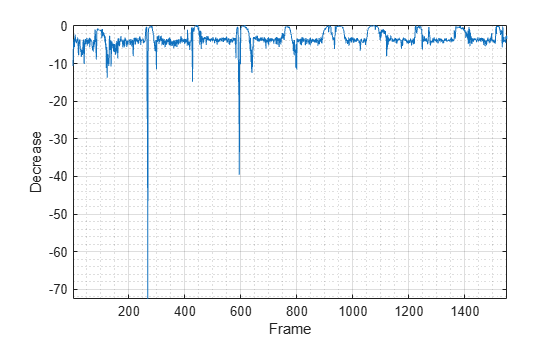
[s,cf] = melSpectrogram(audioIn,fs);Calculate the decrease of the mel spectrogram over time.
decrease = spectralDecrease(s,cf);
Plot the spectral decrease against the frame number.
spectralDecrease(s,cf)
Read in an audio file.
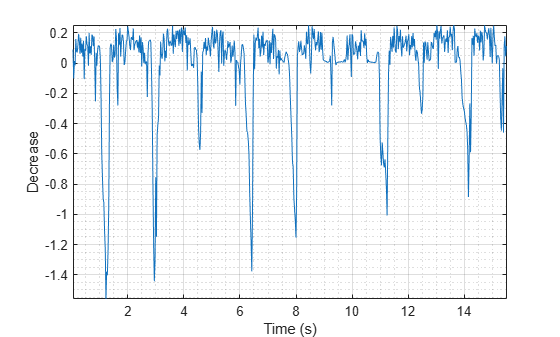
[audioIn,fs] = audioread("Counting-16-44p1-mono-15secs.wav");Calculate the decrease of the magnitude spectrum over time. Calculate the decrease for 50 ms Hamming windows of data with 25 ms overlap. Use the range from 62.5 Hz to fs/2 for the decrease calculation.
decrease = spectralDecrease(audioIn,fs, ...
                           Window=hamming(round(0.05*fs)), ...
                           OverlapLength=round(0.025*fs), ...
                           Range=[62.5,fs/2]);
Plot the spectral decrease.
spectralDecrease(audioIn,fs, ...
                 Window=hamming(round(0.05*fs)), ...
                 OverlapLength=round(0.025*fs), ...
                 Range=[62.5,fs/2])
Create a dsp.AudioFileReader object to read in audio data frame-by-frame. Create a dsp.SignalSink to log the spectral decrease calculation.
fileReader = dsp.AudioFileReader('Counting-16-44p1-mono-15secs.wav');
logger = dsp.SignalSink;
In an audio stream loop:
Read in a frame of audio data.
Calculate the spectral decrease for the frame of audio.
Log the spectral decrease for later plotting.
To calculate the spectral decrease for only a given input frame, specify a window with the same number of samples as the input, and set the overlap length to zero. Plot the logged data.
while ~isDone(fileReader)
    audioIn = fileReader();
    decrease = spectralDecrease(audioIn,fileReader.SampleRate, ...
                                'Window',hamming(size(audioIn,1)), ...
                                'OverlapLength',0);
    logger(decrease)
end

plot(logger.Buffer)
ylabel('Decrease')
Use dsp.AsyncBuffer if
The input to your audio stream loop has a variable samples-per-frame.
The input to your audio stream loop has an inconsistent samples-per-frame with the analysis window of
spectralDecrease.You want to calculate the spectral decrease for overlapped data.
Create a dsp.AsyncBuffer object, reset the logger, and release the file reader.
buff = dsp.AsyncBuffer;
reset(logger)
release(fileReader)
Specify that the spectral decrease is calculated for 50 ms frames with a 25 ms overlap.
fs = fileReader.SampleRate;

samplesPerFrame = round(fs*0.05);
samplesOverlap = round(fs*0.025);

samplesPerHop = samplesPerFrame - samplesOverlap;

win = hamming(samplesPerFrame);

while ~isDone(fileReader)
    audioIn = fileReader();
    write(buff,audioIn);

    while buff.NumUnreadSamples >= samplesPerHop
        audioBuffered = read(buff,samplesPerFrame,samplesOverlap);

        decrease = spectralDecrease(audioBuffered,fs, ...
                                    'Window',win, ...
                                    'OverlapLength',0);
        logger(decrease)
    end

end
release(fileReader)
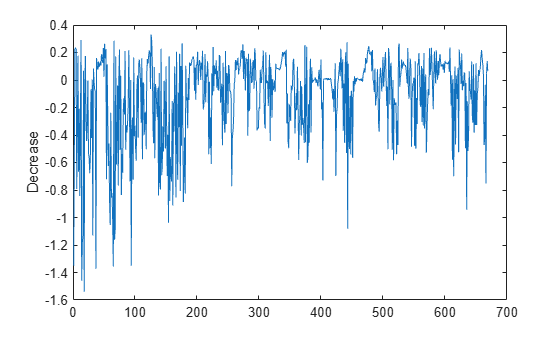
Plot the logged data.
plot(logger.Buffer)
ylabel('Decrease')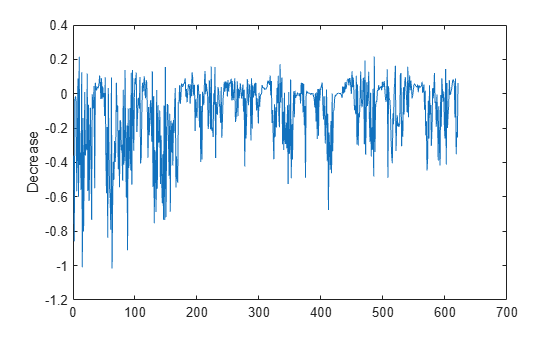
Input Arguments
Name-Value Arguments
Output Arguments
Algorithms
The spectral decrease is calculated as described in [1]:
where
sk is the spectral value at bin k.
b1 and b2 are the band edges, in bins, over which to calculate the spectral decrease.
References
[1] Peeters, G. "A Large Set of Audio Features for Sound Description (Similarity and Classification) in the CUIDADO Project." Technical Report; IRCAM: Paris, France, 2004.
Extended Capabilities
Version History
Introduced in R2019a