polar
(권장되지 않음) 극좌표 플롯
설명
ln = polar(___)는 극좌표 플롯을 만드는 데 사용된 Line 객체를 반환합니다. 극좌표 플롯이 생성된 후 이를 수정하려면 ln을 사용하십시오. 속성 목록은 Line 속성 항목을 참조하십시오.
예제
빨간색 파선을 사용하여 극좌표 플롯을 생성합니다.
theta = 0:0.01:2*pi;
rho = sin(2*theta).*cos(2*theta);
polar(theta,rho,"--r")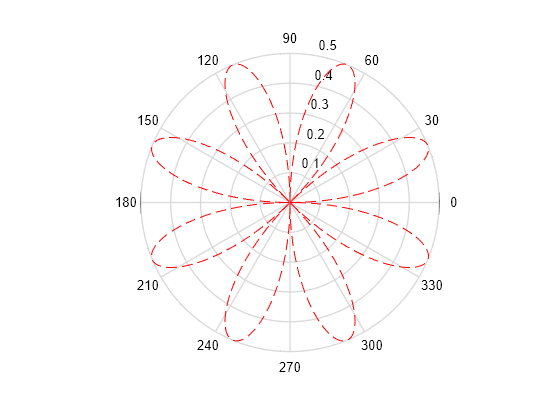
입력 인수
각도 값으로, 벡터나 행렬로 지정됩니다. 값을 라디안으로 지정합니다.
반지름 값으로, 벡터나 행렬로 지정됩니다.
음의 rho 값은 pi만큼 회전한 것으로, 원점 대칭입니다((theta,rho)가 (rho*cos(theta),rho*sin(theta))로 변환되기 때문). 다른 동작을 원할 경우 플로팅을 수행하기 전에 rho를 조작할 수 있습니다. 예를 들어, rho를 max(0,rho)나 abs(rho)와 동일하게 설정할 수 있습니다.
선 스타일, 마커, 색으로, 기호를 포함하는 string형 스칼라 또는 문자형 벡터로 지정됩니다. 기호는 어떤 순서로 지정해도 좋습니다. 세 가지 특성(선 스타일, 마커, 색)을 모두 지정할 필요는 없습니다. 예를 들어 선 스타일을 생략하고 마커를 지정하면 플롯은 마커만 표시하고 선은 표시하지 않습니다.
예: "--or"은 원 마커로 표시된 빨간색 파선입니다.
| 선 스타일 | 설명 | 결과 선 |
|---|---|---|
"-" | 실선 |
|
"--" | 파선 |
|
":" | 점선 |
|
"-." | 일점 쇄선 |
|


| 마커 | 설명 | 결과로 생성되는 마커 |
|---|---|---|
"o" | 원 |
|
"+" | 플러스 기호 |
|
"*" | 별표 |
|
"." | 점 |
|
"x" | 십자 |
|
"_" | 가로선 |
|
"|" | 세로선 |
|
"square" | 정사각형 |
|
"diamond" | 다이아몬드 |
|
"^" | 위쪽 방향 삼각형 |
|
"v" | 아래쪽 방향 삼각형 |
|
">" | 오른쪽 방향 삼각형 |
|
"<" | 왼쪽 방향 삼각형 |
|
"pentagram" | 펜타그램 |
|
"hexagram" | 헥사그램 |
|


| 색 이름 | 짧은 이름 | RGB 3색 | 모양 |
|---|---|---|---|
"red" | "r" | [1 0 0] |
|
"green" | "g" | [0 1 0] |
|
"blue" | "b" | [0 0 1] |
|
"cyan" | "c" | [0 1 1] |
|
"magenta" | "m" | [1 0 1] |
|
"yellow" | "y" | [1 1 0] |
|
"black" | "k" | [0 0 0] |
|
"white" | "w" | [1 1 1] |
|


대상 좌표축으로, Axes 객체로 지정됩니다. 좌표축을 지정하지 않는 경우 MATLAB®은 현재 좌표축으로 플로팅하거나 좌표축이 없다면 Axes 객체를 만듭니다. polar는 PolarAxes 객체로의 플로팅은 지원하지 않습니다.