Automating Endoscopic Tissue Characterization in Cancer Patients with Computer Vision
By Dr. Ronan Cahill, University College Dublin, with Dr. Jeffrey Dalli, University College Dublin, and Paul Huxel, MathWorks
Not long ago, I participated in an interview with RTÉ (Ireland's national television and radio broadcaster) on technology’s role in bringing rapid advances in cancer treatment. During the interview, I talked about a promising initiative at the University College Dublin Centre for Precision Surgery. Our team was investigating the use of image processing technology to analyze video captured during colorectal surgery procedures to discriminate normal tissue from cancerous tissue.
As part of the discussion, I mentioned some of the difficulties our researchers faced as they manually processed video frames looking for changes in near-infrared fluorescence intensity that result from variations in the absorption of indocyanine green (ICG)—a fluorescent dye used in medical diagnostics—in the various types of tissue. A few days later, I received the following message from someone at MathWorks I had never met: “I heard your recent radio interview and think MATLAB and Simulink could add a lot of value in your world if they are not doing so already.”
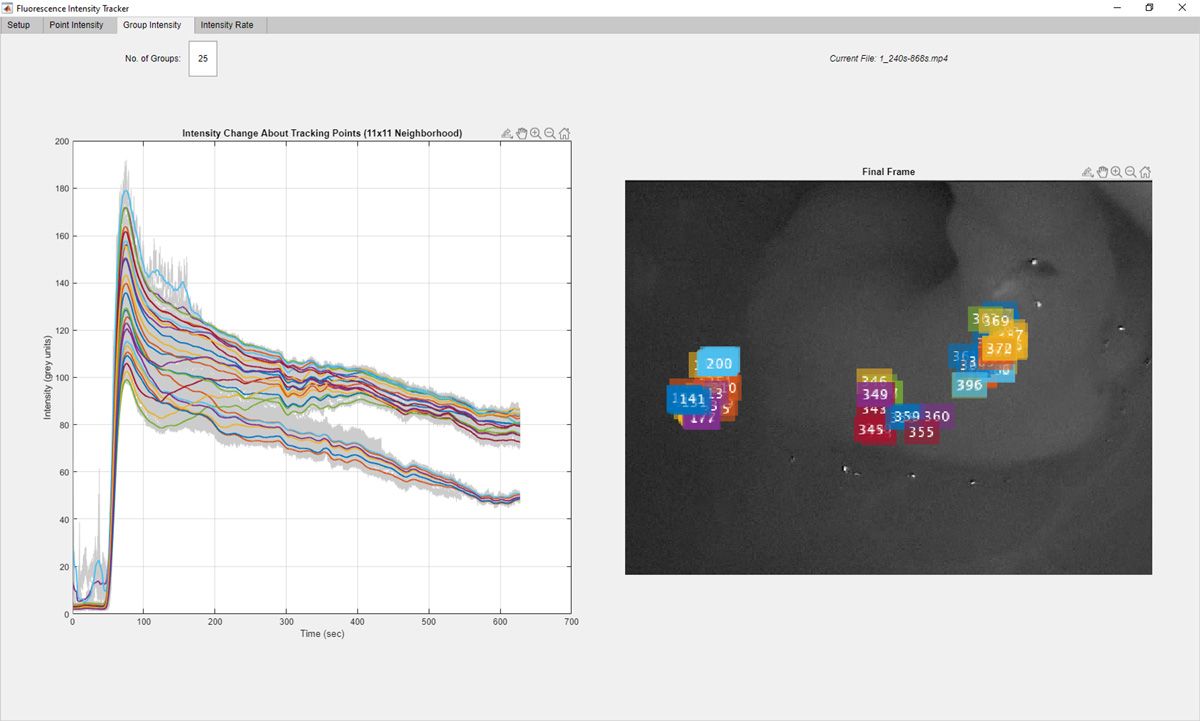
That unsolicited message was the start of a collaboration between MathWorks and our team that culminated in the development of Fluorescence Tracker App (FTA) (Figure 1). FTA is a MATLAB® application that employs computer-vision, point-tracking algorithms to monitor changes in ICG fluorescence intensity in near-infrared (NIR) videos, automating what was previously a slow, labor-intensive process, while delivering more precise and clinically interesting results. FTA enables us to assess NIR video content with objective statistics, rather than subjective visual interpretation, adding an additional layer of data-driven diagnostics and greatly accelerating our research.
How Indocyanine Green (ICG) with Near-Infrared Imaging Works
When ICG is administered to a patient, it enters the blood stream where it binds to proteins in the blood. As it circulates, it is extracted and then excreted by the liver without being metabolized, meaning ICG is harmless. While in the bloodstream, ICG offers an effective way for clinicians to visualize blood perfusion, since ICG becomes fluorescent when excited by near infrared light.
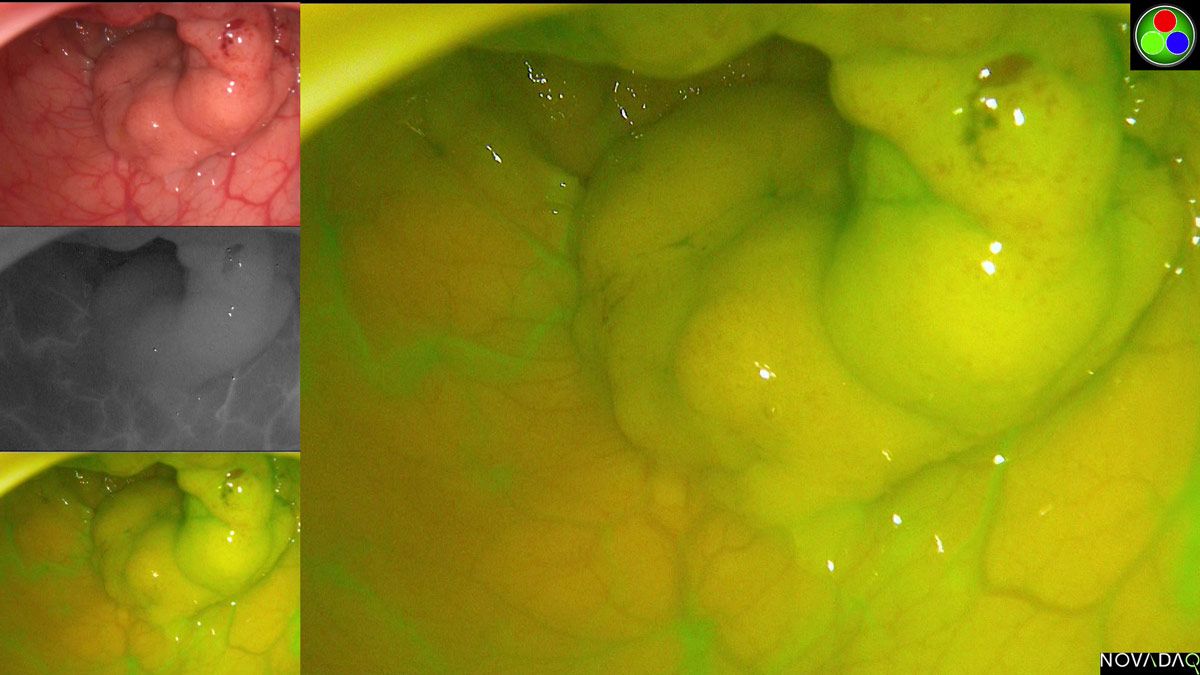
ICG is widely applicable to a variety of clinical use cases. In colorectal endoscopic surgery, for example, we use it with a laparoscopic NIR system to ensure there is adequate blood flow to support healing in two sections of tissue that we are about to join together. The system displays (and captures) simultaneous white light and NIR videos (Figure 2).
While the use of ICG and NIR endoscopy in surgical procedures is fairly widespread, our team’s application in cancerous tissue characterization is new. The fundamental idea behind this novel application is that the perfusion characteristics of cancerous and normal tissue differ, and this difference can be detected by analyzing the fluorescence intensity over time.
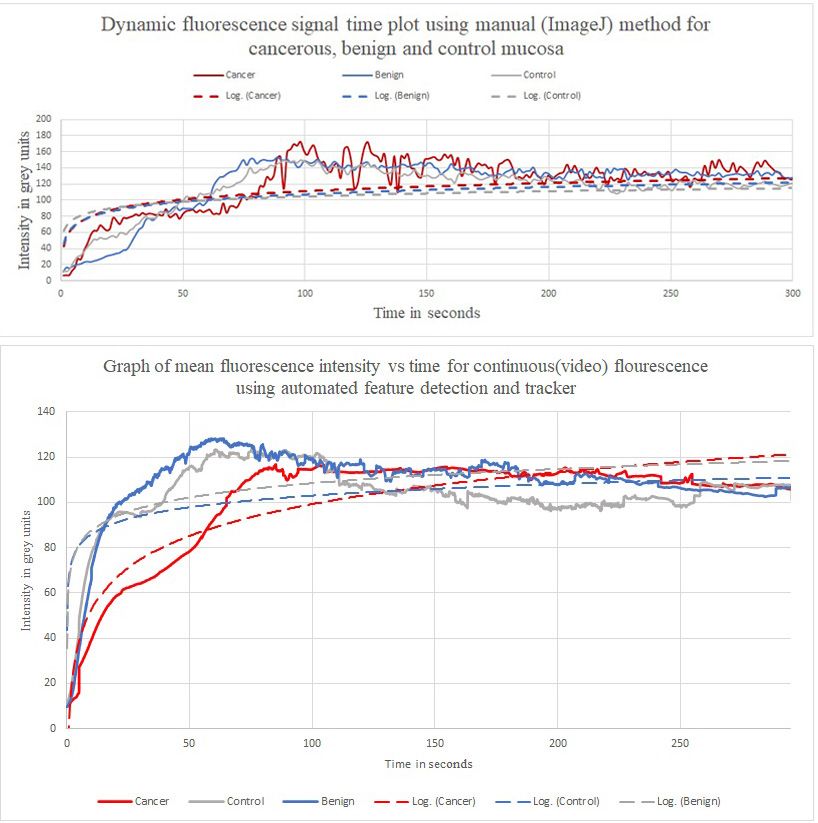
In our early research, before we developed FTA, we performed this analysis by inspecting individual NIR frames of the recorded endoscopy video using ImageJ public domain image processing software. In each frame we would note the intensity of regions that we suspected (and later confirmed via biopsy) were cancerous and regions that were normal. Because this process was so time-consuming, we limited our analysis to just a single frame for every one second of video. When we plotted the resulting time-series intensity signals, it was possible to see differences in the perfusion characteristics of different types of tissue (Figure 3). The low sampling rate of one frame per second (fps), however, made it difficult to smooth the data, and the background noise impaired our ability to perform statistical analysis.
By automating feature detection, tracking, and intensity quantification with MATLAB, we achieved a much higher sampling rate of 30 fps, which enabled smoother curves and yielded richer data for analysis. At the same time, this automation enabled us to complete the analysis of each video in a matter of minutes, rather than spending an hour to complete the process manually.
Developing Image Processing Algorithms for Fluorescence Tracker App
We based the initial development of our FTA algorithms on the face detection and tracking example in Computer Vision Toolbox™. With this as a starting point, we quickly built a MATLAB script to load video, select regions of interest, automatically select features within those regions, and then track those features across frames using a Kanade-Lucas-Tomasi (KLT) algorithm. We evaluated several different feature detection algorithms from the toolbox, such as FAST, BRISK, and SURF, before returning to the minimum eigenvalue algorithm, which performed best for our videos. The availability of more than just one algorithm was particularly helpful in our work— as it is in any exploratory research.
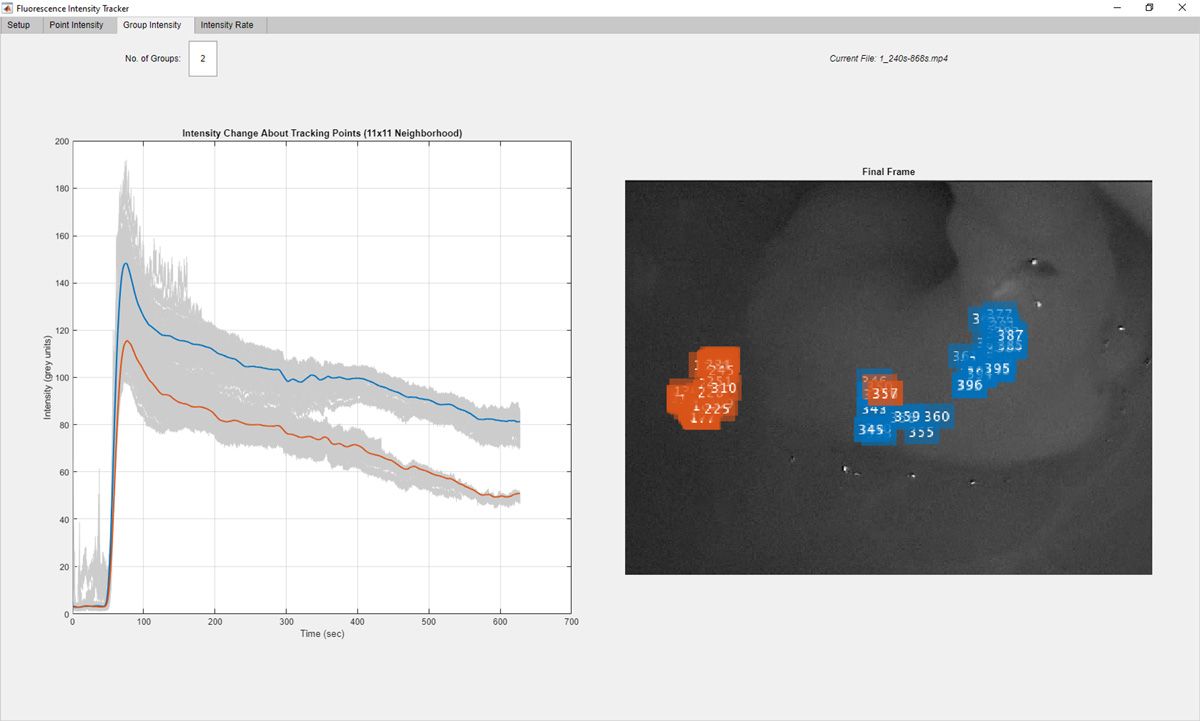
Once we had implemented reliable feature tracking, we began extending the script to extract intensity information for the tracked points. Specifically, we added steps to compute an average intensity for the area (an 11 x 11 box of pixels, for example) around each tracked point and then plot the time history of those smoothed average intensity values. Finally, we used k-means clustering to classify the points into groups, which clearly show the distinct perfusion profiles for two different areas of interest (Figure 4).
Packaging FTA as a Standalone App
After further refining and testing our MATLAB code, we used App Designer to create a user interface for region selection, feature detection and tracking, and k-means clustering. We then used MATLAB Compiler™ to package this interface and the underlying algorithms into a standalone app. Once we had a version of FTA that we could run on any computer, our efficiency increased dramatically. We were able to bring more people into the project, because now anyone could run the automated analyses, even if they had no experience with, or license for, MATLAB.
Planned Enhancements
The research we conducted using FTA has been published and we are now looking forward to expanding our research and extending the capabilities of the app in multiple promising directions. Our plans include increasing the diversity of our source video data by including patients from different geographic regions, for example. The ability of the standalone app makes this easier, as researchers from around the world can use it to analyze their own videos, if it’s not feasible for them to share the videos with us.
We’re also exploring the possibility of using the same approach to discriminate other types of cancer, including sarcoma and ovarian cancer, as well as with other types of dye.
One particularly exciting development path involves adding support for near real-time processing of video data. This capability would provide surgeons with additional information about the tissue as they perform a procedure and could potentially help them profile a tumor without removing it. In this scenario, the surgeon would be assisted in making a decision to, for example, excise or ablate tissue on the spot, thereby simplifying the patient treatment journey.
As we continue our own work with FTA, we’ve shared its code on File Exchange, where it is freely available for other research groups to explore and use.
Published 2022


