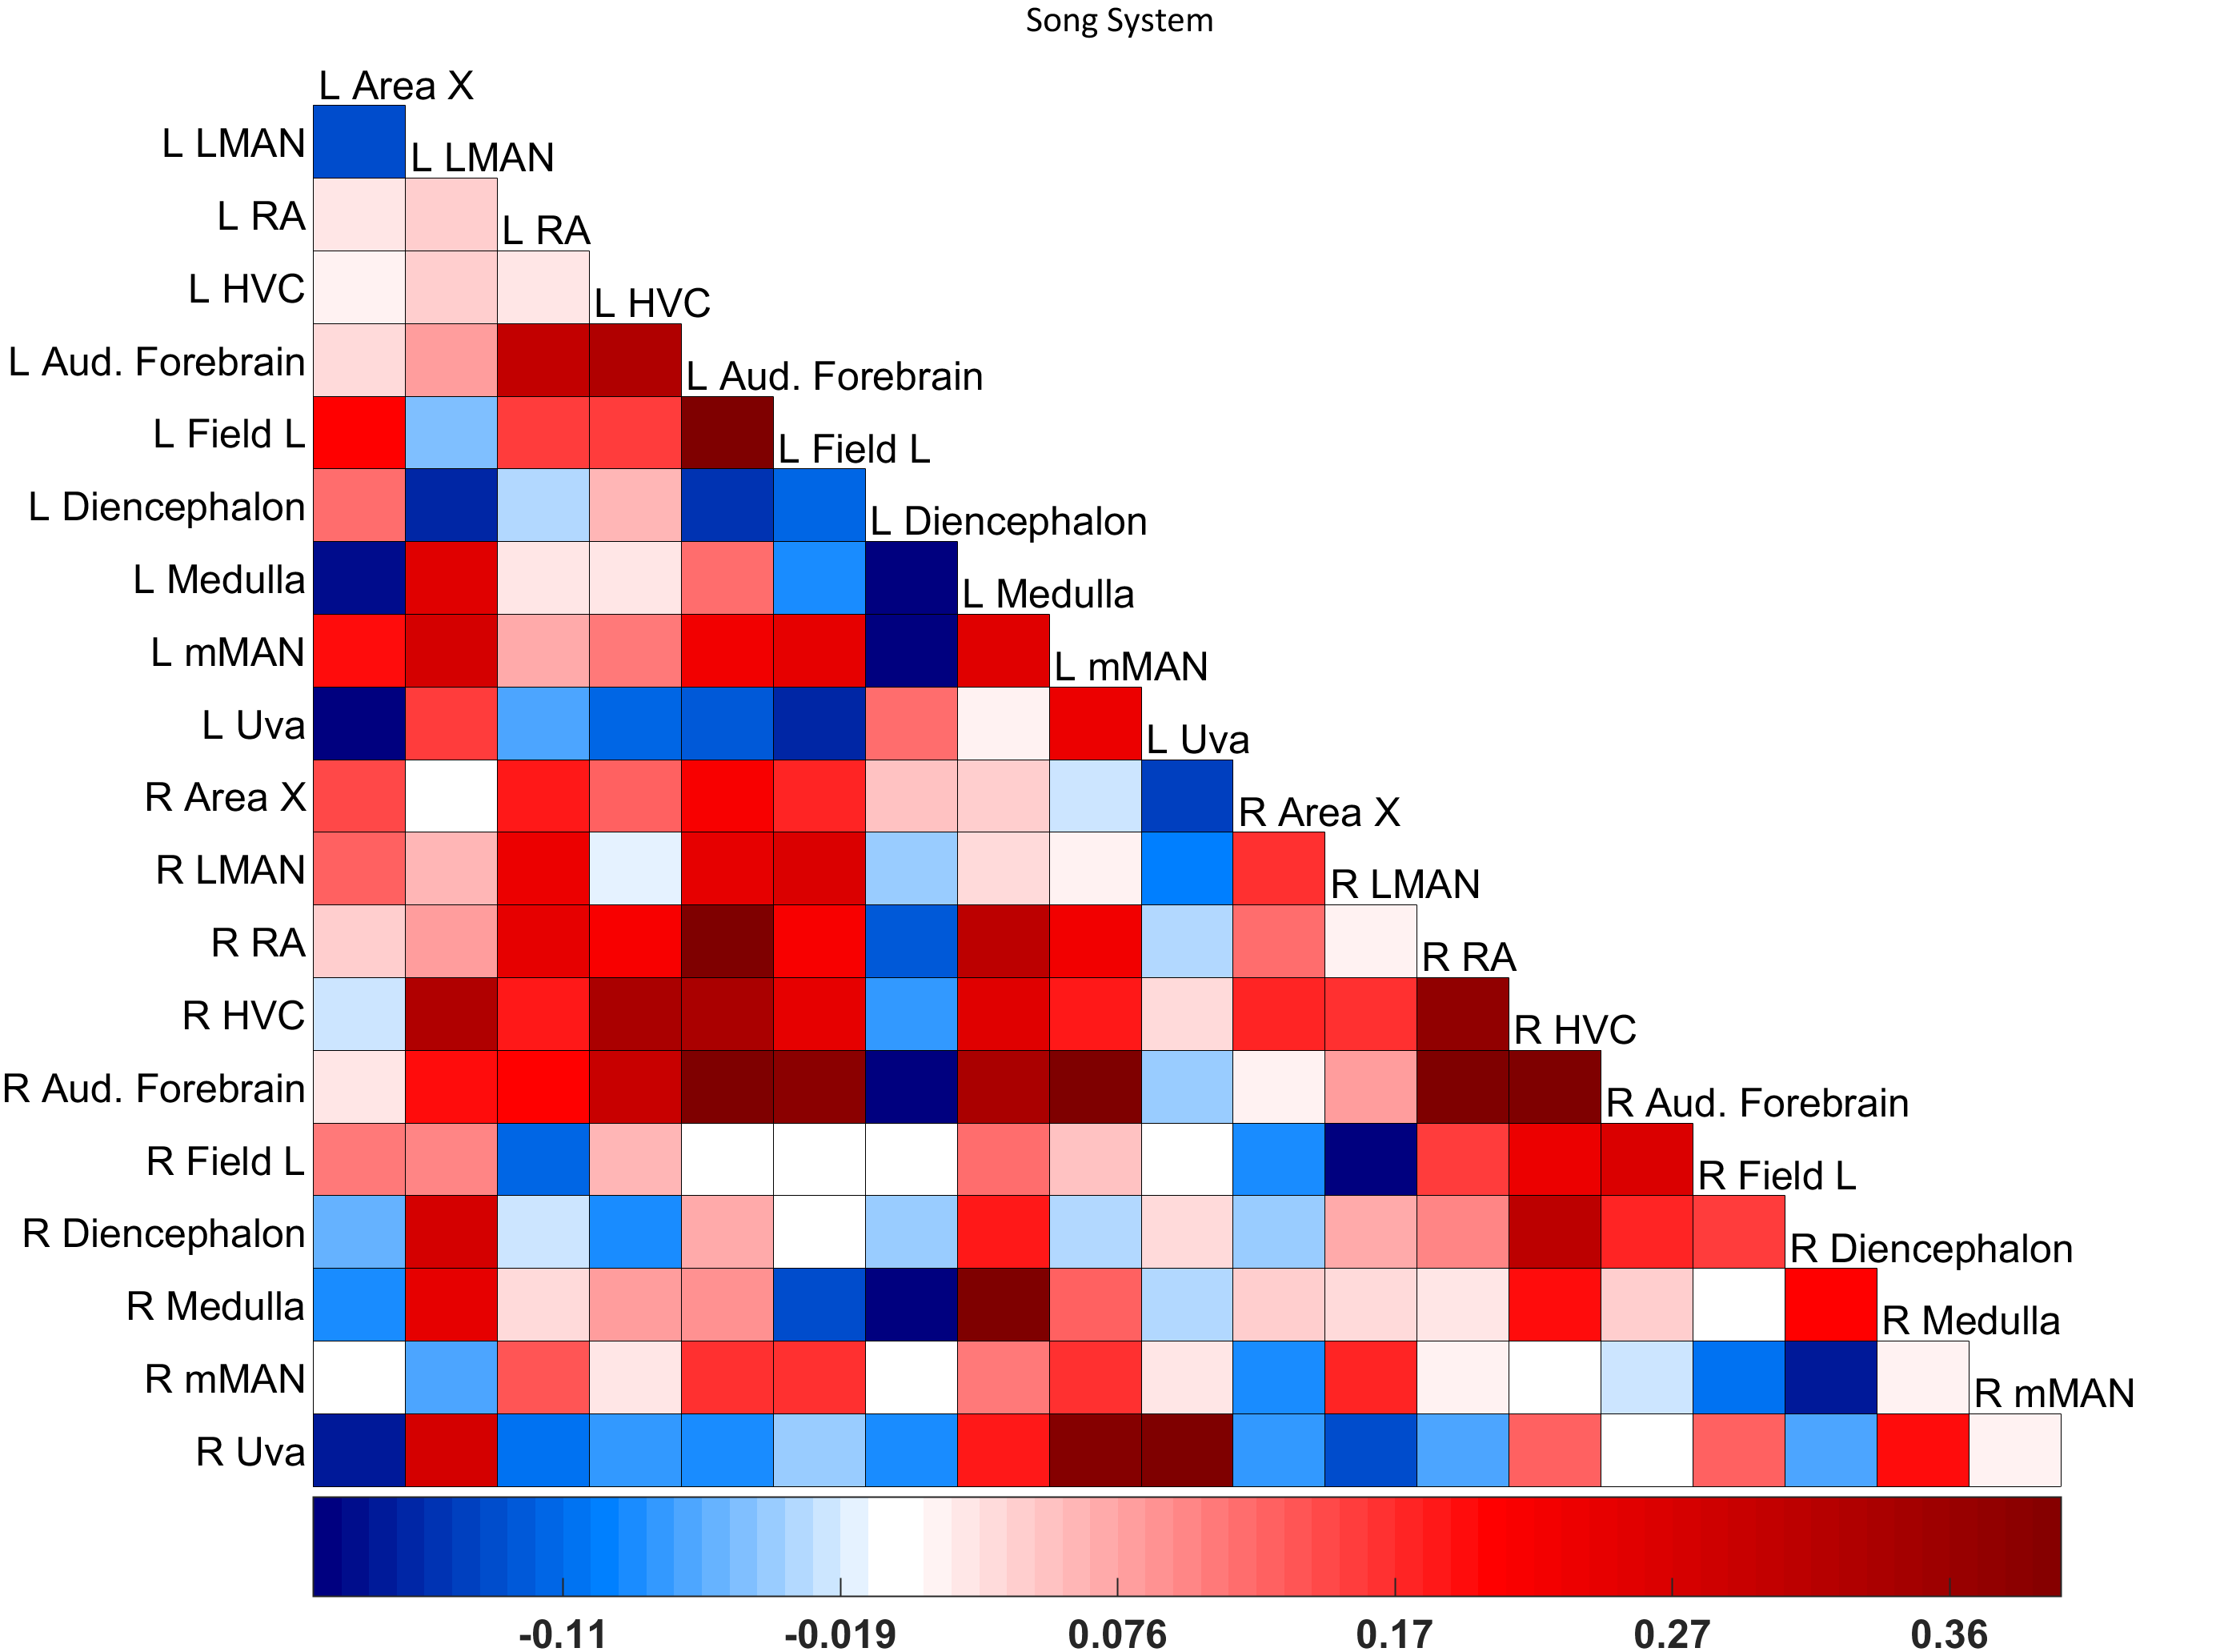
A Matlab utility for plotting correlation matrices, with similar appearance to Seaborn in Python.
이 제출물을 팔로우합니다
- 팔로우하는 게시물 피드에서 업데이트를 확인할 수 있습니다
- 정보 수신 기본 설정에 따라 이메일을 받을 수 있습니다
A Matlab utility for plotting correlation matrices, with similar appearance to Seaborn in Python.
I created this function to allow flexible, customizable plotting of correlation matrices for brain functional connectivity data. However, it works for plotting any correlation matrix or grid data. If desired, it is capable of computing correlation matrices directly from fMRI images, and can even complete simple preprocessing like detrending and bandpass filtering. The plot_corrmat.m help section contains documentation for all input parameters, as well as many helpful hints.
Please see Layden et al. (2019), Figure 2a for an example use case (https://www.sciencedirect.com/science/article/abs/pii/S1053811919302642). Or navigate to the linked Github page for examples.
인용 양식
Layden, E. A., Schertz, K. E., London, S. E., & Berman, M. G. (2019). Interhemispheric functional connectivity in the zebra finch brain, absent the corpus callosum in normal ontogeny. NeuroImage, 195, 113-127.
GitHub 디폴트 브랜치를 사용하는 버전은 다운로드할 수 없음
| 버전 | 퍼블리시됨 | 릴리스 정보 | Action |
|---|---|---|---|
| 1.0.1 | -update description |
||
| 1.0.0 |
