Spectrogram Visualization with Matlab
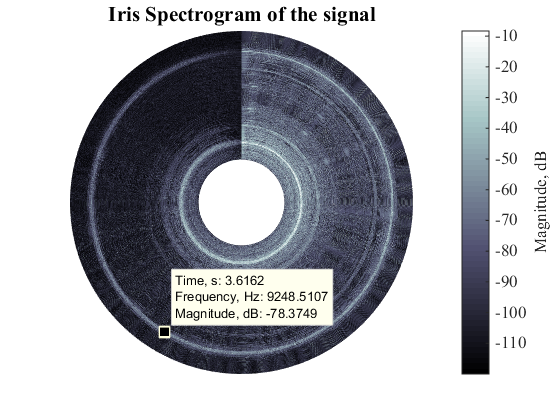
Irisgram - a new kind of visual representation of the time-frequency spectrogram.

이 제출물을 팔로우합니다
- 팔로우하는 게시물 피드에서 업데이트를 확인할 수 있습니다
- 정보 수신 기본 설정에 따라 이메일을 받을 수 있습니다
인용 양식
H. Zhivomirov. A Novel Visual Representation of the Signals in the Time-Frequency Domain. The Scientific Bulletin, Series C: Electrical Engineering and Computer Science, ISSN: 2286-3540, Vol. 80, Issue 3, pp. 75-84, 2018. (https://www.scientificbulletin.upb.ro/rev_docs_arhiva/rez786_869448.pdf)
Hristo Zhivomirov (2026). Spectrogram Visualization with Matlab (https://kr.mathworks.com/matlabcentral/fileexchange/64882-spectrogram-visualization-with-matlab), MATLAB Central File Exchange. 검색 날짜: .

