Honeycomb

Tools for hexagonal binning (honeycomb plot) and visualisation

https://github.com/erikhuizinga/honeycomb

이 제출물을 팔로우합니다

[Installation]
Put all files somewhere on your MATLAB path. At least, honeycomb.m and the private directory (with contents) should be in the same directory on the MATLAB path.
[Documentation]
Run help honeycomb or doc honeycomb for instructions.

[Example]
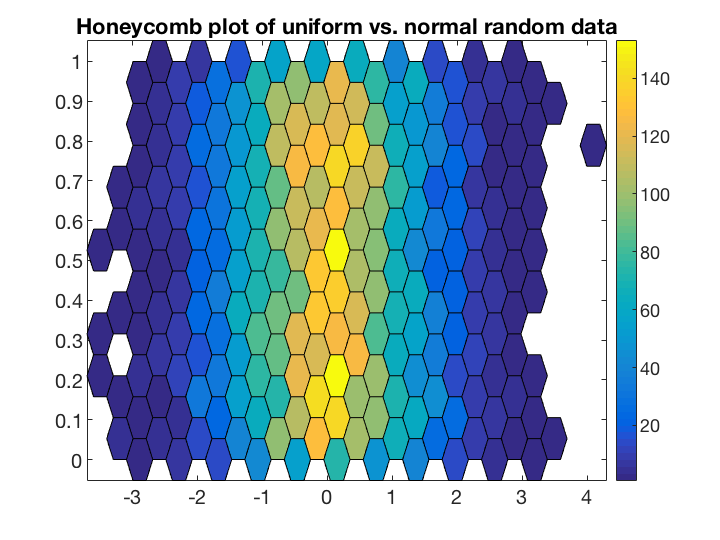
The following code produces the image seen on this page.

x = randn(100);
y = rand(size(x));
figure
honeycomb(x, y)
colorbar
title 'Honeycomb plot of uniform vs. normal random data'

[Credits]
The files that inspired this file are listed on this page, but do not contain the same functionality due to different use cases or bugs. Therefore I developed my own implementation of the hexagonal scatter plot. Other sources include:
http://bioconductor.org/packages/2.0/bioc/html/hexbin.html (hexbin for R)
http://dx.doi.org/10.1213/ane.0000000000001665 (scientific article using honeycomb plots, you may not have access to the journal)

[Version]
The true version of this release is 0.1 (as per GitHub), but the File Exchange does not allow version numbers lower than 1.x. Therefore, I've set the version to 1.0.0.1. Future updates will bump the number to be identical on both File Exchange and GitHub.

인용 양식

Erik (2026). Honeycomb (https://github.com/erikhuizinga/honeycomb), GitHub. 검색 날짜: .

도움

도움 받은 파일: Hexagonal Scatter Plot, hexscatter.m

MATLAB 릴리스 호환 정보

  • 모든 릴리스와 호환

플랫폼 호환성

  • Windows
  • macOS
  • Linux

GitHub 디폴트 브랜치를 사용하는 버전은 다운로드할 수 없음

버전 퍼블리시됨 릴리스 정보 Action
1.0.0.1

이 GitHub 애드온의 문제를 보거나 보고하려면 GitHub 리포지토리로 가십시오.