이 제출물을 팔로우합니다
- 팔로우하는 게시물 피드에서 업데이트를 확인할 수 있습니다
- 정보 수신 기본 설정에 따라 이메일을 받을 수 있습니다
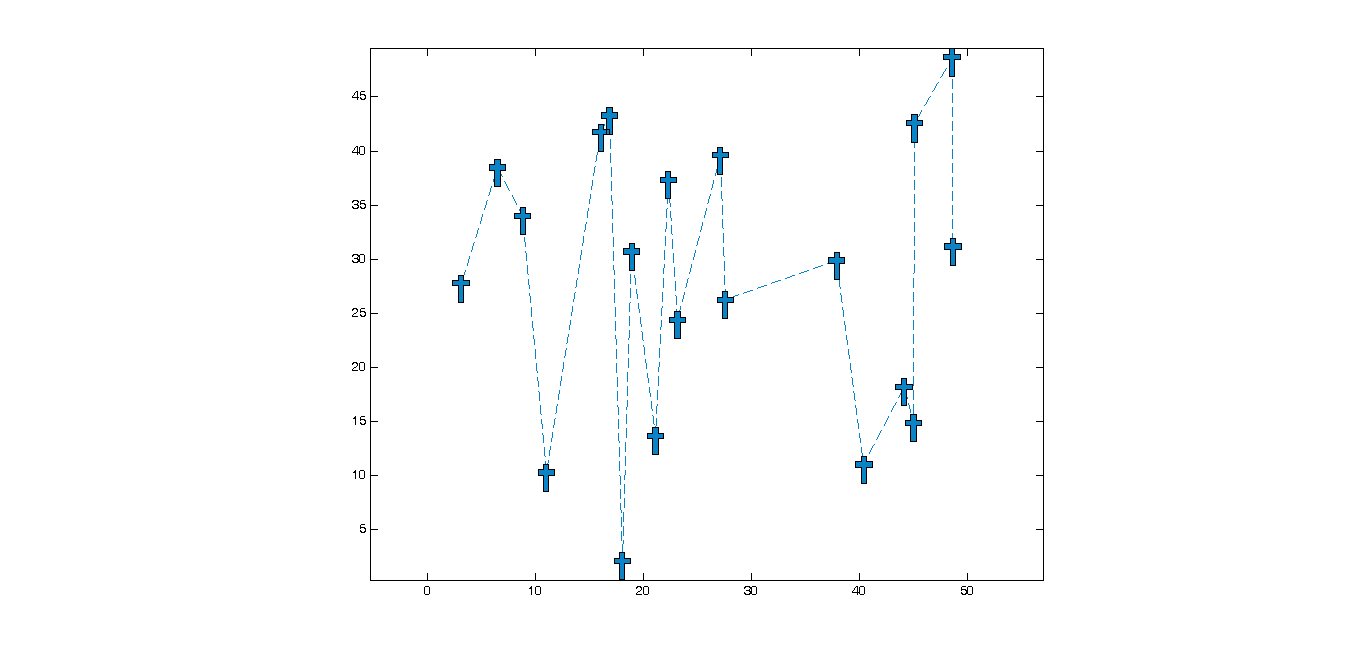
This simple code enables you to plot using custom markers. It uses custom patches instead of Matlab built-in markers.
As the input, you need to provide x and y for the data points, like you do in regular plots. You also need to provide x and y data for your custom marker, assuming the center of the marker is at (0,0). You need to also provide the scale for your marker, which is analogous to Matlab's marker size.
인용 양식
Salman Mashayekh (2026). Custom Marker Plot (https://kr.mathworks.com/matlabcentral/fileexchange/39487-custom-marker-plot), MATLAB Central File Exchange. 검색 날짜: .
| 버전 | 퍼블리시됨 | 릴리스 정보 | Action |
|---|---|---|---|
| 1.0.0.0 |
