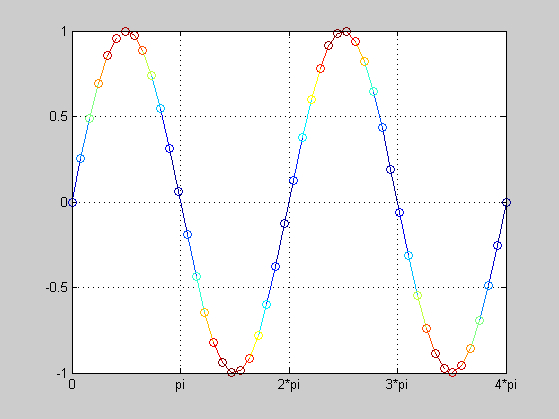
Conditionally Colored Plot (CCPLOT)

Plots conditionally colored (2D line) graphs.

이 제출물을 팔로우합니다

Plots the vector Y versus vector X using conditional coloring based on colormaps.

The condition vector C is independent of the values of X and Y but must be the same size.

The colormap MAP can either be a Matlab or a userdefined colormap.

Example:
x = linspace(0,4*pi,50);
y = sin(x);
c = y.^2;
map = colormap(jet);
h = ccplot(x,y,c,map);
set(h,'Marker','o');

인용 양식

Michael Heidingsfeld (2026). Conditionally Colored Plot (CCPLOT) (https://kr.mathworks.com/matlabcentral/fileexchange/37725-conditionally-colored-plot-ccplot), MATLAB Central File Exchange. 검색 날짜: .

도움

도움 받은 파일: Conditionally colored line plot

카테고리

Help CenterMATLAB Answers에서 Color and Styling에 대해 자세히 알아보기

일반 정보

MATLAB 릴리스 호환 정보

  • 모든 릴리스와 호환

플랫폼 호환성

  • Windows
  • macOS
  • Linux
버전 퍼블리시됨 릴리스 정보 Action
1.1.0.0

* Fixed minor error in example

1.0.0.0