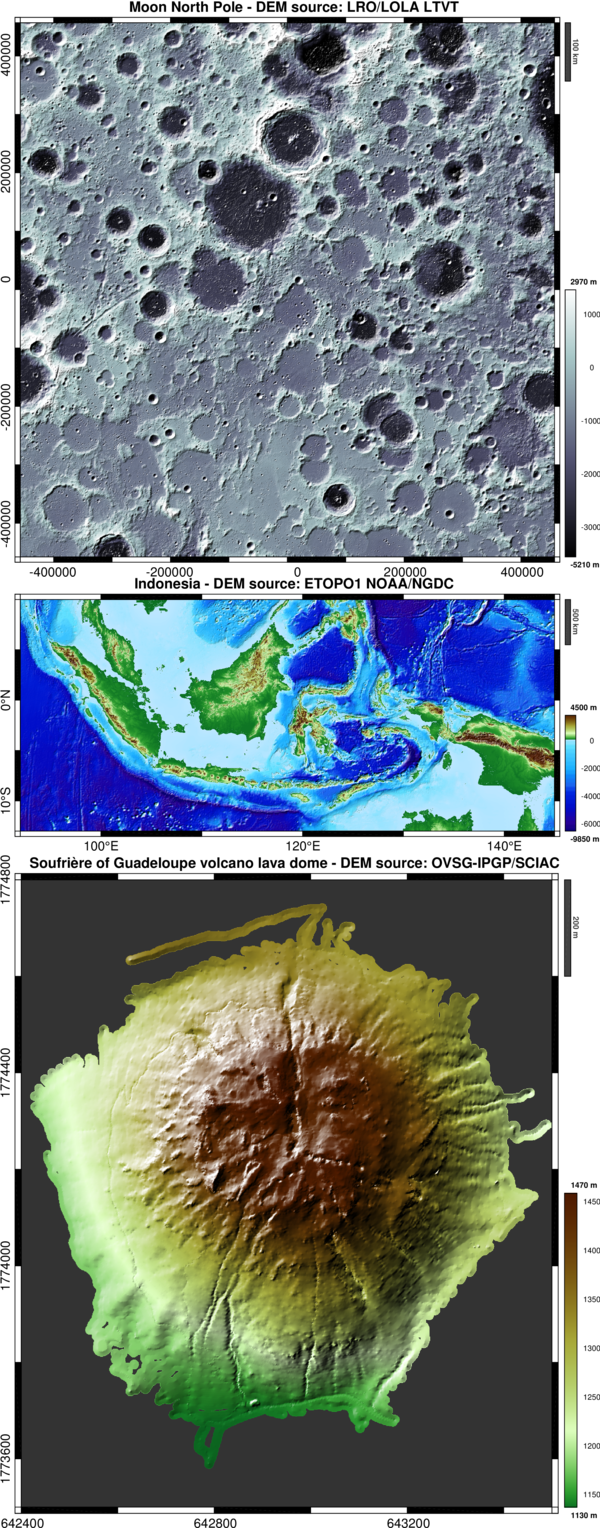
DEM: Shaded relief image plot (digital elevation model)
Pretty shaded relief map as flat image.

이 제출물을 팔로우합니다
- 팔로우하는 게시물 피드에서 업데이트를 확인할 수 있습니다
- 정보 수신 기본 설정에 따라 이메일을 받을 수 있습니다
인용 양식
François Beauducel (2026). DEM: Shaded relief image plot (digital elevation model) (https://kr.mathworks.com/matlabcentral/fileexchange/36380-dem-shaded-relief-image-plot-digital-elevation-model), MATLAB Central File Exchange. 검색 날짜: .
| 버전 | 퍼블리시됨 | 릴리스 정보 | Action |
|---|---|---|---|
| 2.6.0 | - improves the colormap splitting between land and sea
|
||
| 2.2.0 | - new option 'position' for tick labels
|
||
| 2.1.0 | minor fix |
||
| 2.0.0 | legend scale is now liberated from the figure colormap (thanks to Tomke Froechtenich's comment). No use of freezecolors needed to add other colormap plots. |
||
| 1.10.0 | improve backward compatibility (strjoijn) |
||
| 1.9.0 | - new options: 'km', 'watermark', 'fontsize', 'bordersize'
|
||
| 1.8.0 | - improved light rendering (using surface normals instead of gradient)
|
||
| 1.7.0 | - adds 'interp' option (fill the gaps)
|
||
| 1.6.0 | - adds a 'lake' option
|
||
| 1.5.0 | now accepts row/column vectors for X and/or Y. |
||
| 1.4.0 | - adds basemap-style axis in decimal or lat/lon modes
|
||
| 1.3.0 | - new landcolor.m colormap function
|
||
| 1.2.0 | ZIP now contains landcolor.dat companion file. |
||
| 1.1.0 | Optimizations: adds a decimation for large DEM grids. |
||
| 1.0.0 |

