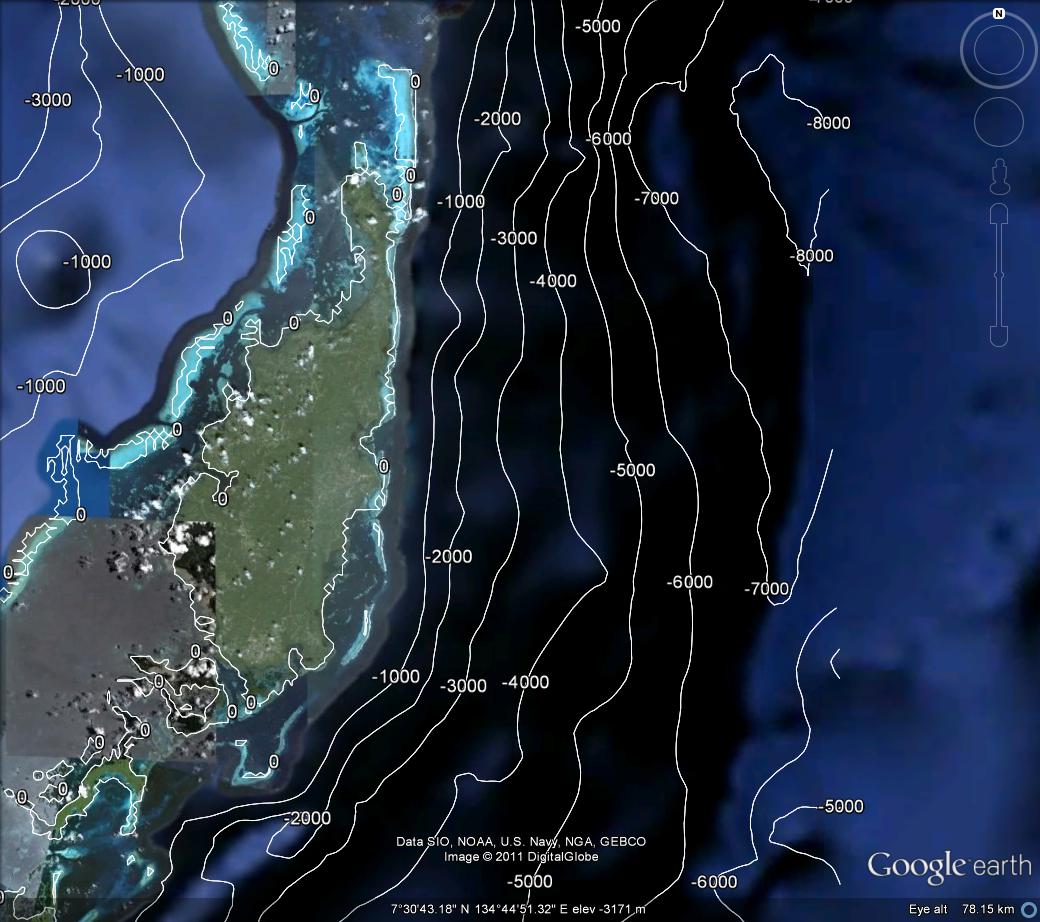
kml contour plot

Create a Google Earth KML file with labelled contour lines.

이 제출물을 팔로우합니다

This function can be called exactly the same as one would call MATLAB's CONTOUR function. It directly calls CONTOUR and then takes the output and converts it into a KML file, so that the contour lines display nicely and natively in Google Earth.

NOTE:
If you want to change the color and/or width of the contour lines, you will have to edit lines 38-40 of the function. There are some comments there to guide you.

Syntax:
KML_CONTOUR(LON,LAT,Z) writes contour lines in the same format as
matlab's CONTOUR(LON,LAT,Z) or CONTOURC(LON,LAT,Z).
KML_CONTOUR(LON,LAT,Z,N) draws N contour lines, overriding the
automatic value
KML_CONTOUR(LON,LAT,Z,V) draws LENGTH(V) contour lines at the values
specified in the vector V
KML_CONTOUR(LON,LAT,Z,[v v]) computes a single contour at the level v

Input:
LON: This can be either a matrix the same size as Z or a vector with
length the same as the number of columns in Z.
LAT: This can be either a matrix the same size as Z or a vector with
length the same as the number of rows in Z.
Z: Matrix of elevations

Output:
This function creates a kml file called 'doc.kml' in the current
working directory

for anyone interested, I also have a version written in Python available here:
http://www.cameronsparr.com/pytools/

인용 양식

Cameron Sparr (2026). kml contour plot (https://kr.mathworks.com/matlabcentral/fileexchange/33800-kml-contour-plot), MATLAB Central File Exchange. 검색 날짜: .

일반 정보

MATLAB 릴리스 호환 정보

  • 모든 릴리스와 호환

플랫폼 호환성

  • Windows
  • macOS
  • Linux
버전 퍼블리시됨 릴리스 정보 Action
1.3.0.0

Changed the contour labelling algorithm so that it uses the MATLAB native scheme when given lon,lat,z as a grid, and the proprietary scheme when lon,lat are a list.

1.2.0.0

Added support for changing the color and width of the contour lines.

1.1.0.0

added link to python version

1.0.0.0