histograms for ND data

Create histograms for ND data using ND bins

이 제출물을 팔로우합니다

histnd Histogram count of ND data with ND bins

histmat = histnd(x, y, ..., xedges, yedges, ...)
Extract ND histogram data containing the number of events
of [x, y, ...] tuples that fall in each bin of the ND-grid defined by
xedges, yedges, .... The edges are passed to histc internally and should
therefore conform to histc's input restrictions: the edge-vectors should
be monotonically non-decreasing.

[histmat, nOOF, OOFidx] = histnd(x, y, ..., xedges, yedges, ...)
If any values are outside of the range of the edges, they are not
counted. The number of those cases and their linear index in the input
data is however returned in the second and third output arguments.

EXAMPLES

events = 1000000;
x1 = sqrt(0.05)*randn(events,1)-0.5; x2 = sqrt(0.05)*randn(events,1)+0.5;
y1 = sqrt(0.05)*randn(events,1)+0.5; y2 = sqrt(0.05)*randn(events,1)-0.5;
x= [x1;x2]; y = [y1;y2];

For linearly spaced edges:
xedges = linspace(-1,1,64); yedges = linspace(-1,1,64);
histmat = histnd(x, y, xedges, yedges);
figure; pcolor(xedges,yedges,histmat'); colorbar ; axis square tight ;

For nonlinearly spaced edges:
xedges_ = logspace(0,log10(3),64)-2; yedges_ = linspace(-1,1,64);
histmat_ = histnd(x, y, xedges_, yedges_);
figure; pcolor(xedges_,yedges_,histmat_'); colorbar ; axis square tight ;

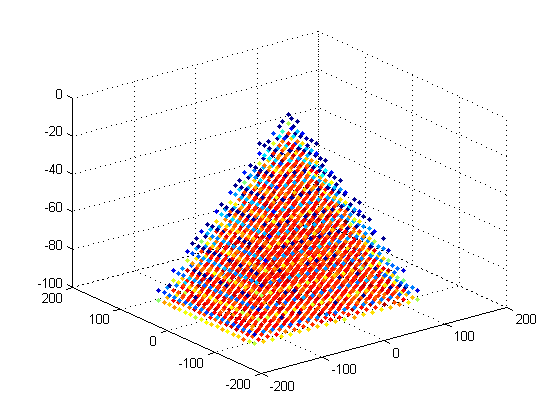
3D data
x = 3.*randn(640000,1);
y = 1.*randn(640000,1);
z = 1.*randn(640000,1);
histmat = histnd(x,y,z,linspace(min(x),max(x),20),linspace(min(y),max(y),20),linspace(min(z),max(z),20));
% make 3D hist, color of points indicates count
[xp,yp,zp] = meshgrid(linspace(min(x),max(x),20),linspace(min(y),max(y),20),linspace(min(z),max(z),20));
% cut away histogram positions where count is 0
qzero = histmat==0;
histmat(qzero) = [];
xp(qzero) = [];
yp(qzero) = [];
zp(qzero) = [];
% draw points
figure;%('Renderer','OpenGL') % might need the openGL renderer to handle so many points
ax = scatter3(xp(:),yp(:),zp(:),'.');
% color them according to count
cdata = histmat(:)./max(histmat);
set(ax,'CData',cdata);
xlabel('X'), ylabel('Y'), zlabel('Z')

인용 양식

Diederick (2026). histograms for ND data (https://kr.mathworks.com/matlabcentral/fileexchange/31889-histograms-for-nd-data), MATLAB Central File Exchange. 검색 날짜: .

도움

도움 받은 파일: 2D Histogram Calculation

일반 정보

MATLAB 릴리스 호환 정보

  • 모든 릴리스와 호환

플랫폼 호환성

  • Windows
  • macOS
  • Linux
버전 퍼블리시됨 릴리스 정보 Action
1.0.0.0