
이 제출물을 팔로우합니다
- 팔로우하는 게시물 피드에서 업데이트를 확인할 수 있습니다
- 정보 수신 기본 설정에 따라 이메일을 받을 수 있습니다
인용 양식
Adam Aitkenhead (2026). Plot a 3D array using patch (https://kr.mathworks.com/matlabcentral/fileexchange/28497-plot-a-3d-array-using-patch), MATLAB Central File Exchange. 검색 날짜: .
도움
도움 준 파일: Spectral Imaging Toolbox
| 버전 | 퍼블리시됨 | 릴리스 정보 | Action |
|---|---|---|---|
| 1.11.0 | The user can now define the lower and upper limits of the colorbar using the input parameter 'clim'. Also, the input flag 'sym' has been removed as this can be done using clim instead. |
||
| 1.9.0 | Provide the handle to the colorbar as an optional output. |
||
| 1.8.0 | Some minor code optimisations |
||
| 1.7.0 | Bugfix: Prevent a hole from appearing at the lowest values in a full colour plot. |
||
| 1.5.0 | The user can now specify the colour map for the display of a 3D numeric array. |
||
| 1.4.0 | Minor bugfix |
||
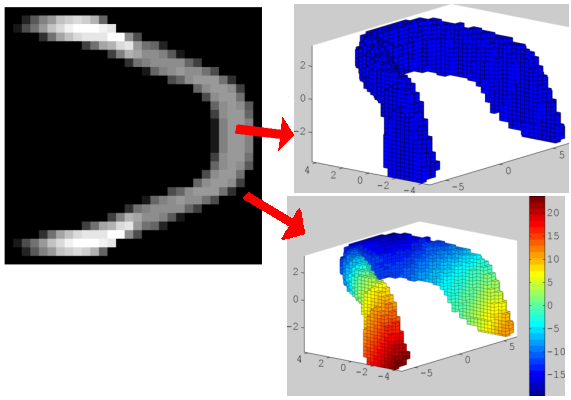
| 1.3.0 | Now enables a 3D numeric array to be plotted such that each facet corresponds to the value of each voxel in the array. |
||
| 1.2.0 | Added missing example.mat file |
||
| 1.1.0 | Improved documentation |
||
| 1.0.0 |

