Editor's Note: This file was selected as MATLAB Central Pick of the Week
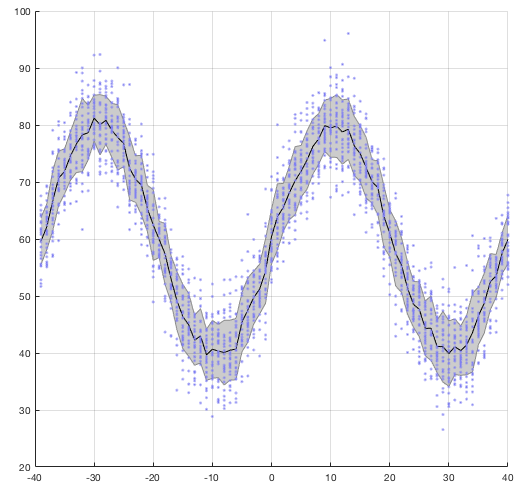
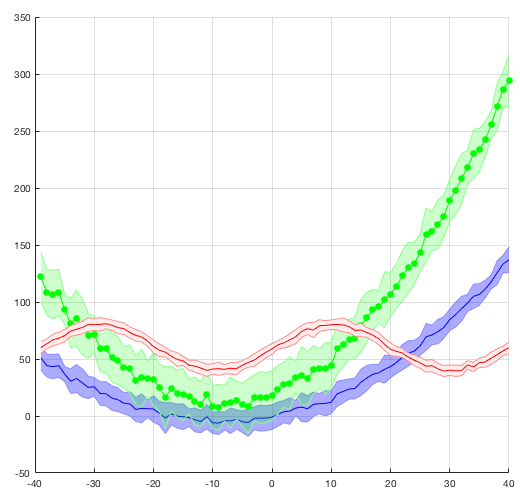
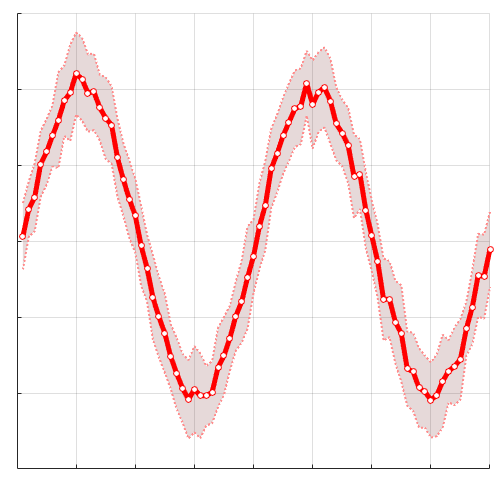
shadedErrorBar is a MATLAB function that creates a continuous shaded error region around a line rather than discrete bars. The error region can either be specified explicitly or calculated on the fly based upon function handles. The appearance of the plot can be modified via input argumets and/or the handles of the returned plot objects. You will need OpenGL to get transparency to work.
There are detailed examples along with example images on the GitHub page: https://github.com/raacampbell/shadedErrorBar
Rob Campbell (2021). raacampbell/shadedErrorBar (https://github.com/raacampbell/shadedErrorBar), GitHub. Retrieved .
Inspired: superbar, shplot, errorshade, Murphy Diagrams, shade_significant_timepoints, fillPlot(mat,varargin), boundedline.m, Mean square displacement analysis of particles trajectories, Shaded Error Bar YY, mseb(x,y,errBar,lineProps,transparent), gQSPSim
Find the treasures in MATLAB Central and discover how the community can help you!
Start Hunting!Create scripts with code, output, and formatted text in a single executable document.
Did anyone find the solution using this function with loglog, semilogx, or semilogy axis?
Love the function. Used it a lot.
Under some circumstances it appears to result in a matlab crash though.
It produces a system error ('Access violation')
Has anyone else encountered this?
There is no such feature. You would have to modify the function to achieve this. Or maybe see if you can a similar affect by messing with the returned plot handles.
Hi Rob,
This is a great function that I use frequently. Do you have any examples of how to manipulate this to generate a one-sided Y Error bar, similar to functionality which exists in Excel? I played around with manipulating the errBar portion but was unsuccessful. Thanks for your time!
Yes, the examples the colour is changed with an RGB triplet after the data are plotted.
Thank you. I saw those examples but this is what I was looking for:
shadedErrorBar(x, mean(y), err_bar(y) ,'lineprops', {'color', [255, 83, 26]/255} ,'patchSaturation',0.4);
After some playing I found it myself ;)
Examples are here: https://github.com/raacampbell/shadedErrorBar
It's a great function, thanks. Is it possible to change the color of the error bars by using RGB colors? If so, could you give an example of use? Thank you
You can use the SEM function from here: https://github.com/raacampbell/notBoxPlot/tree/master/code/%2BNBP if you wish. It's supplied as a function handle. i.e. it is an argument supplied to shadedErrorBar.
This is great, thanks. However, I wonder if there's a simple way (e.g. a parameter) where one can choose whether to plot the SEM (as the script already does) or 95% confidence intervals?
Aron, this is done via the third input argument. You can supply any function of your choice for calculating the line and the shaded region. See function help for examples.
Hi, thanks for the great function. Is there a way to have the error bar represent SEM rather than SD? Thanks.
I suggest reading through the MATLAB plotting docs. You want "box on", in this case.
Hi,
Thanks for this really neat function. I was wondering there is a way to get a proper bounding box with the axes. Right now the top and right axes don't appear
Ariel, not there isn't. That's a different sort of plot you're describing.
Just following up on Joshua Baker's question from 2018. Is there any way to have error bars for both x and y - for example if there was a point with horizontal and vertical error bars and this function would plot a shaded area around that single point? Thank you!
Margarita Etchegaray Bello, Run the function with an output argument to return the handles to the plotted objects and modify them post-hoc. That will do what you want.
Thank you so much! After trying several options your function was the only one that did exactly what I wanted. However, I have 7 lines and would like to use the Matlab default colors, but they do not have a short name, is it possible to type either the hexadecimal or the RGB triplet in your function?
It's not case sensitive, if that's what was confusing you.
Ryan, in the function help it states:
"% 'lineProps' - ['-k' by default] defines the properties of
% the data line. e.g.:
% 'or-', or {'-or','markerfacecolor',[1,0.2,0.2]}"
Is that what you meant or do you have a different question?
what is 'lineprops'? You use it lots without anywhere defining it.
Zahra and Song Lin Chua, please look at the function documentation and the demo example file. Everything you need to know is there.
I keep getting the error:
??? Error using ==> shadedErrorBar at 92
length(x) must equal length(errBar)
how should I correct the sizes? right now both my x and y are of size 1 * 230.
How can I add my own error bars? I have the % error for my vales. Thanks
Bram, if what you have is easier or more elegant than something like the following then maybe I'd include it. e.g. I would do:
%plot some stuff
clf
hold on
for ii=1:3
p{ii}=shadedErrorBar([],rand(30,40)+ii,{@mean,@std});
end
%Change all lines at once
cellfun(@(x) set(x.mainLine, 'LineWidth',2),p)
Same thing works on different plots, making it just one line to set everything. In general I'm trying to avoid having too many plot appearance setting options as input arguments when the same thing can be done modifying the handles post-hoc. Just keeps it leaner. But it depends exactly what you've done, which is a little unclear to me from the description.
If you wish, you can fork it on GitHub and send a pull request. Instructions for doing this on GitHub README page. That has the advantage that even if I don't merge it, your changes are still available for everyone to see and are accessible from my GitHub page.
Very nice function! I made some small adjustments in it. Mostly for plotting multiple errorbars in one figure, so that you don't have to change the LineWidth for every individual errorbar plot. I did this by inserting a figure number option and LineWidth option. Should I share this with you?
You ought to be able to achieve this by using @nanmean for the line instead of @mean
Is there a way to omit NaNs when using shadederrorbar to calculate means?
So I've been trying to use shadedErrorBar for displaying the error bars for three lines of data that I have, but I'm getting an error message.
I'm having a little difficulty understanding what the error message means: (Error using shadedErrorBar : length(x) must equal length(errBar))
Okay thank you. Will do.
This also tells me nothing and is getting beyond the scope of these comments. Please file a GitHub issue describing exactly the steps that produce the error and what the error is.
Hi Rob. Thank you for your reply. I am using Matlab academic version. Since I am getting an error using the function shadedErrorBar in my program, I tried compiling your examples from the GitHub thread. The error read,
Error in errorbarplot2 (line 6)
shadedErrorBar(x,y,{@mean,@std},'lineprops','-b','patchSaturation',0.33)
-The error shading looks really good. Hope I will be able to resolve this issue with your help. Thank you for the code :)
Adarsh, please describe exactly what is not working. I have no way of knowing what is wrong based on what your question.
I am unable to use it in version R2018a. is there any package that needs to be installed initially for shadedErrorBar" to work? Thanks.
It returns handles to everything. See the examples on the GitHub page.
I don't understand how to change the marker size of the shaded region.. Help!
The function returns the plot handles, so you can do what you wish with those.
How can I change the marker size?
Great function!
I was finally able to find a solution for the only thing that was missing: the legend. I shared it here: https://nl.mathworks.com/matlabcentral/answers/18448-excluding-legend-entries-in-plot#answer_185078
It's awesome! thx!
I think I would just DIY the legend. Make some patches and some labels manually. Maybe there's a better way, but I don't know what it is. More likely to look nice if you roll your own, though.
Great work.
I have an issue. when I plot the error bar. The color of the legend is different from the color of the plot. It is because of the property of the patch. The patchSaturation is set to 0.2. (It is necessary then we can see several error bar).
how do we deal with the difference of color? which is important when we plot.
thanks a lot.
Great work!!!
How to use this function for plotting multiple plots with respective legends using it in a for loop?
Robert, I would just interpolate through the NaNs then feed these new data to the function. I don't follow your other question, though. The last example doesn't involve NaNs and for me it works. Can you explain how it doesn't work?
Very nice and helpful function! Wondering if would be possible not to plot NaNs values (e.g. middle or extremes of a vector)? I followed your last example (https://github.com/raacampbell/shadedErrorBar), but cannot make it work. Any more specific suggestions on how to do this will be very much appreciated!
Has anybody managed to create a 2D error plot, as in, X x Y with shaded deviations on each axis?. e.g. i am people attempts at drawing circles on a graphics tablet. I have both X and Y vectors, each with std across the board. I was to plot X x Y with shaded error on both axes. Thank you
Has anyone found a way to keep the shading when using a semilog plot with
set(gca,'YScale','log') ?
Seems like something is wrong with the patching?!
Anyone who wants to plot RGB defined colors, can do it like this:
'lineprops', {'color', [0 0 1]}, which plots a blue line, and so on.
If you can supply it as a function handle, it should work.
Hello! This is great. Quick question: do you have a version or know of a quick change so that I can pass a curvefit/continuous equation to the parser and use the 95% confidence intervals as the error bars? Thank you :-)
You can set those values to NaNs via the returned plot object. See last example: https://github.com/raacampbell/shadedErrorBar
Thanks! Really useful. I have a problem though. I have a Vector that contains nans in the middle. I would like the function not to plot the errorbar on those NAN values. Is there a way to do it?
Wow, that's a top tip!
You need to save it as a vector file. Change the figure window "Renderers" property to "painters" and re-save it.
This is a very helpful function, thanks!
I saved the figure as an .eps file and am trying to edit it in Adobe Illustrator, but cannot access the elements like usually with .eps files. Do you have any suggestion as to how I can do this? Thanks.
That's probably a mistake that crept in when I was testing something. It'll show up only if you try asymmetric error bars. I corrected it and added an example in the demo showing how the asymmetric error bars work.
I'm comparing to an older version of shadedErrorBar, and it seems the error bar calculation has been switched from
uE=y+errBar(1,:);
lE=y-errBar(2,:);
to
uE=y-errBar(1,:);
lE=y+errBar(2,:);
Was the definition of errBar negated in some release?
This. Is. Great. Thank you
Yes, you can edit the plot objects after they are rendered. See the examples and here: https://github.com/raacampbell/shadedErrorBar and also for more general info here: https://ch.mathworks.com/matlabcentral/answers/151011-how-to-plot-a-line-of-a-certian-color
Very helpful function. I wonder if 'lineProps' command only works with standard colors defined in Matlab (i.e. m,k, etc)? Is there a way to specify color outside of the base with user defined [R G B] style?
William, what about rotating the axes? https://ch.mathworks.com/matlabcentral/answers/228449-how-to-rotate-plot-using-code
America. I will see if I have time next week to look into that. Never tried it with yy axis. Can you also either e-mail me a minimal example for producing that error (see my profile for contact details) or add the info here: https://github.com/raacampbell/shadedErrorBar/issues/12 I prefer not to these comments as this isn't a good place to handle support issues.
Hey, thanks for the function, it works beautifly when you have only one y axis.
However, i'm trying to use it with two graphs using yyaxis and it's sending an error message, any clue on how can i fix it? thanks!
Error using matlab.graphics.axis.Axes/set
Children may only be set to a permutation of itself
Error in uistack (line 134)
set(UParent,'Children',AllChildren);
Error in shadedErrorBar>makePlot (line 193)
uistack(H.mainLine,'top') % Bring the main line to the top
Error in shadedErrorBar (line 126)
H = makePlot(x,y,errBar,lineProps,transparent,patchSaturation);
I'd also like to make a horizontal shaded error plot. I see you discussed this in Nov (22, 24). Is there a way to do this with this tool?
Hi all. Is it possible to make invisible the shaded error bar when "errBar" is NaN? As it is right now, it seems to be linearly interpolating the shaded area from the last non-nan to the next one. Thanks!
Matteo, can you give me an example of what you're trying to do? Do you just want to rotate the axes?
nice solution but how can i plot 'horizontal' errobar?
Very nice tool. In case anyone else was unclear, when 'errBar' is a vector, the shaded error is drawn symmetrically as +/- errBar rather than centering the error about y. This is demonstrated by: shadedErrorBar([1:.1:10],repmat(3,1,91), repmat(2,1,91)); ylim([0,6])
It would be nice to have the ability to plot error in the x axis rather than Y.
Thanks! I have problem with legend of two plots that I used hold on for them but the legend just shown for the last plot.
Thanks. Really appreciated!
This function is very useful, thank you so much! My only issue is that I cannot plot multiple shadedErrorBars in app designer. It will pop up in another figure window and I can't figure out how to hold on using the function. Could someone help with this? Thanks!
Aditya - the code doesn't do that right now. It's a good suggestion. I'll implement it when I have time.
Istvan, did you try the last input argument that handles transparency?
Thanks for this but can you let me know how can I plot in such a way that two plots do not completely cover each other but rather come out as on your example?
Thanks a lot for this function!!
Thank you for the function! Is there any way to save the figure in such a way that it enables changing it in illustrator? saveas(figure,path,'epsc') doesn't work...
Great function!
Very useful function, thanks a lot!! It saved me much time and lines of code :)
Can you please provide a working example where we have asymmetric error bars?
Thanks for this great code!
I got some troubles using datenum values on the x-axis. I have data points every 0.5 seconds over 30 minutes, but I want to plot the actual time on x instead just a duration. With the duration from 0 to 30 minutes I got no problems, but with the datenum-values the error shades form triangular areas all over the plot. Did anybody experience something similar?
Terrific function. Very ease to use. Thanks a huge lot!
Great function, however, is there a way to use if for displaying x error bars?
Great function!
I found that adding
if isdatetime(xP)
xP = datenum(xP);
end
at Line 144 meant that I could use datetime values as the x input.
Great function, thanks!
One question - the graphs I get are very heavy (6 MB and more when saved to PDF).
Any ideas on how to make them smaller?
My bad, I didn't clear my workspace and it influenced the x and y.
Evan, I updated the submission to a GitHub page that I think already has the change you mention. I think it's narginchk, not nargoutchk, that you mean.
I'll check out the 2016a issue.
Fantastic! Thanks!
Only, note that with MATLAB2016a you need to change line 53 to error(nargoutchk(3,5,nargin))
Flexible suggestion for a legend:
for i = ...
h=shadedErrorBar(x_i, y_i, {@mean,@std});
h.mainLine.DisplayName = name_i;
end
legend(findobj(gca, '-regexp', 'DisplayName', '[^'']'));
Is there a way to specify line and shading color outside of the base? The 'color' line property when specified as the [R G B] style is not accepted (or I am doing it wrong)
Hello,
People have reported a few issues recently that I haven't seen until now. I'll get around to updating stuff soon.
the left and bottom axes are a problem for me too. I just plotted a black line for the axes there. Not a great fix, but it works
Hey Philip thanks for your reply.
Yes I try with set(gca,'YScale','log') and I can see the lien but the shading is gone.
anyway to fix this?
Juan,
The simplest way to change the plot to semilogy is to add
set(gca,'YScale','log');
to the function. Unfortunately, it looks like the shading is lost in semilogy (though retained in semilogx), even though the error bounds are plotted. Is this an issue with patch?
hi,
I am trying to use this function but need to do it in a semilog plot (semilogy). Can you tell me if there is anyway to do so?
thanks
Hi Rob,
I was wondering if it is possible to add an option in your function allowing to flip the x and y axis ? Otherwise, that's a great function !
THIS FUNCTION DOESNT WORK:
Out of memory. The likely cause is an
infinite recursion within the program.
Some suggested updates:
- use 'narginchk' instead of 'nargchk'
- use uistack(H.main_line,'top'); instead of deleting and re-plotting the line
My short version (with some removed functionality):
function H = shplot(x,y,e,varargin)
%% shplot(x,y,e,opt,varargin)
% Striped down version of shplot
% Based on a code by Rob Campbell
% Written by Marcin Konowalczyk
% Timmel Group @ Oxford University
x = x(:); y = y(:);
isheld = ishold; if ~isheld; cla; hold on; end;
H.main_line = plot(x,y,varargin{:});
eu = y + e; el = y - e;
col = 0.15*get(H.main_line,'color') + 0.85; ecol = 3*col-2;
set(gcf,'renderer','painters');
H.patch = patch([x ;flipud(x)],[el ;flipud(eu)],1,'facecolor',col,'edgecolor','none','facealpha',1);
H.edge_u = plot(x,eu,'-','color',ecol);
H.edge_l = plot(x,el,'-','color',ecol);
uistack(H.main_line,'top');
if ~isheld; hold off; end;
end
Nice!
The lines and the shaded region are not the same color for me, as in the example.
Thanks for the helpful function. However, it seems like the shaded colors disappear when I go to logscale? Is there a way to fix this?
Sorry I meant to say left and bottom axes lines rather than x axes.
Thank you for this function! However when I set my shaded errors bars to be transparent the left and bottom x axes disappear. They reappear if I go set(gca, 'linewidth', 2) thereby making the axes thicker, but the right and top axes then are disproportionately think.
Has anyone figured out how to avoid the axes disappearing or bring them back once they've disappeared?
Great, thanks!
Very new to Matlab and do not understand how to use this in my code? Can anyone explain step by step how to use it? I spent hours and I haven't succeeded in plotting one graph yet. Thank you
YMusic: This is what I do to save the figure.
h=figure, shadedErrorBar(Ctrl(:,1), Ctrl(:,2),Std_Ctrl(:,2),'-k', 1)
hold on,
shadedErrorBar(T5(:,1), T5(:,2), Std_T5(:,2),'-y',1)
print(h,'-djpeg','-r600','FileName')
I hope it is useful for you.
Fantastic plots, BUT.... I can't get savefig or print to work... in your description you say to "plot2svg (FEX submission 7401) if you wish to get high quality printed files", but do you know somewhere that I could find an example of you doing this? I can't get it to work and it says that it can't save a struct. I tried changing it using num2cell and struct2table. I have ~200 shadederrorbars on one figure. Any guidance is appreciated. Thank you in advance!
Mich: the command returns the handles to the plot objects so to increase line thickness you can modify the plot object properties: http://www.matlab-cookbook.com/recipes/0050_Plotting/0010_Plot_Manipulation/029_whatIsAHandle.html
I managed to add legend for my graph. I missed out one of Campbell's previous comment.
Here is it for those who might face the same pbl! :
A=shadedErrorBar(x,y,{@mean,@std},'-b',1);
hold on
B=shadedErrorBar(x,y+10,{@mean,@std},'-r',1);
>> A %This is what's in the handles
A =
mainLine: 174.0065
patch: 175.0050
edge: [176.0026 177.0026]
legend([A.mainLine,B.mainLine],'A','B')
Thank you so much for this code!! Helped me alot! :D
Can i check how should i add legend and increase the thickness of the main line? I tried reading the comments to get some help but i dont quite uds.
Sarah -- try the boundedline submission listed on the "This file inspired" bit in the File Information, above.
Thank you for this function. How can I do the same thing if the shaded variable is the x and not y? (plot of altitude vs concentration for example, where the concentration has a range of values to be calculated with the shadederrorbar function)
Thanks!
Very nice, very helpful.
I have added ",'HandleVisibility','off'" to the patch and the edge lines (code lines 146,150 and 151). In that way, one can use "legend" in a created plot, and only the main lines are listed.
Super awesome. Easy to use. Beautiful graphics.
very helpful! Thank you.
Constantinos,
Etsi?
y=randn(30,80)+10; x=1:size(y,2);
shadedErrorBar(log(x),y,{@median,@std},{'r-o','markerfacecolor','r'});
Thanks for this code, it is a very nice way to represent standard errors. I just have an issue I can't solve: In one of my graphs, I would like to use a logarithmic scale for the x axis.. as soon as i change it from linear to log on the figure manager (or if i use set(gca,'xscale','log')), the axis change to log but the graph remains the same.. I have the feeling the function is not compatible to log graphs. do you have any idea how i could solve this problem? i tried to replace all "plot()" in your code with "semilogx()" but it also did not work.
Thanks in advance
Bernadette, set(gcf,'Renderer','Painters')
http://www.mathworks.com/help/matlab/ref/figure_props.html
thanks for this nice code, unfortuntately i can't figure out this openGL thing.. you wrote that if it's saved as.eps then it will look like a raster, and that's what it does in my plot but I don't know how to change it?! can you help?
Very powerful and convenient to use!
Now thank you very much, your second option works perfect. This is what I need. I wish I can give you 5 stars now :).
You should include this in the description. It's really helpful :).
Thank you one more time
Slavi, the behavior you see is is typical of functions such as this because each line is made up of multiple plot elements and the legend command doesn't know anything about that. There are two ways for you to proceed. Firstly, use the "axes" command in order to make a set of legend axes, then build your own legend within these axes. It'll be a bit of pain, but you get the most flexibility this way. Secondly, you can tell the legend command which plot elements to use:
A=shadedErrorBar(x,y,{@mean,@std},'-b',1);
hold on
B=shadedErrorBar(x,y+10,{@mean,@std},'-r',1);
>> A %This is what's in the handles
A =
mainLine: 174.0065
patch: 175.0050
edge: [176.0026 177.0026]
legend([A.mainLine,B.mainLine],'A','B')
Very helpful :). But unfortunately I can't display only the Y-values in the legend. There are more additional data sets in the legend I can't delete.
Do you have any idea? :)
what is shade error bar? i try to execute it but cannot.
Very helpful function. Thanks!