groupedSpacedBoxchart
Boxcharts with space between groups (MATLAB function).
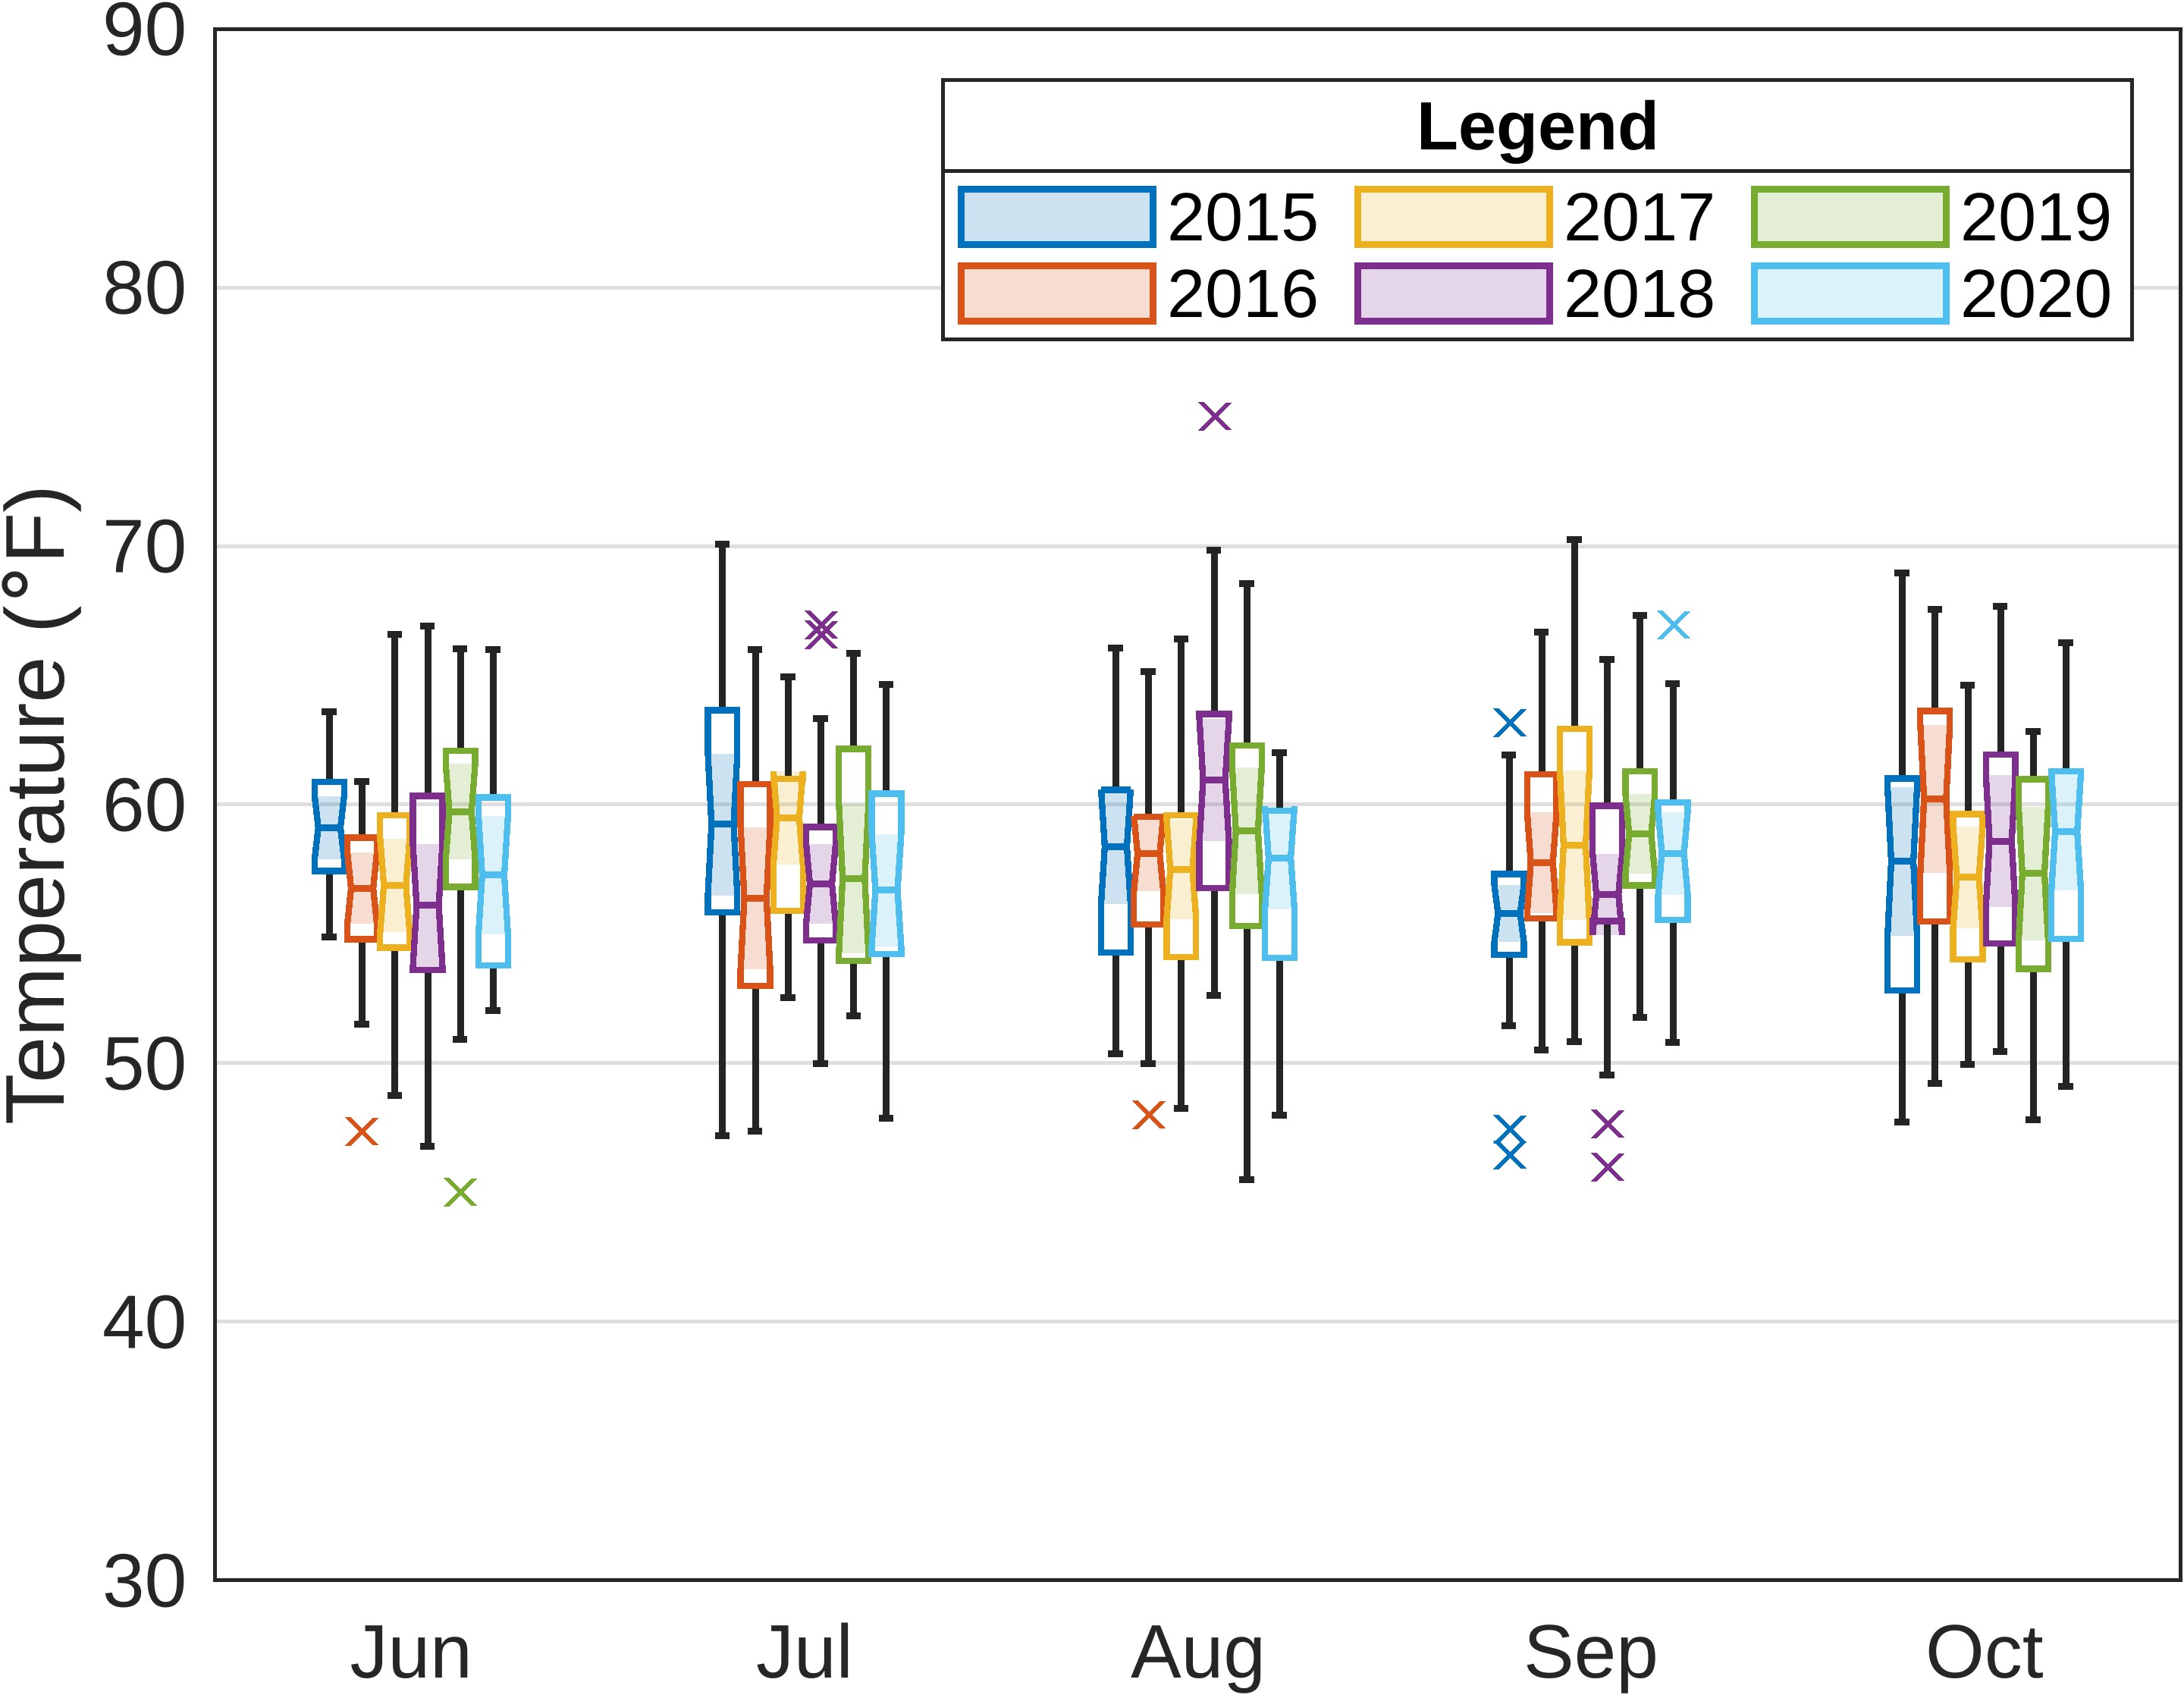
Inspired by Sudhee's question on MATLAB Answers (https://www.mathworks.com/matlabcentral/answers/2120996), the groupedSpacedBoxchart function is a modified version of the base function boxchart. The modified function adds extra space between grouped data in a boxchart visualization, thereby making it easier to distinguish between the groups.
Syntax
-
groupedSpacedBoxchart(dataTable,x,y,groups) -
groupedSpacedBoxchart(...,varargin) -
axHandle = groupedSpacedBoxchart(...)
Inputs
-
dataTable- Table containing your original data -
x- Name of XData variable (ex. 'Month') -
y- Name of YData variable (ex. 'Temperature') -
groups- Name of the variable you wish to group the data by (ex. 'Year') -
varargin- (Optional) name/value pairs compatible with the boxchart() function
Outputs
-
axHandle- Chart axes handle
Examples
 load temperature_data
 plt = groupedSpacedBoxchart(data,'Month','TemperatureF','Year');

 % With optional inputs
 plt2 = groupedSpacedBoxchart(data,'Month','TemperatureF','Year',...
        'BoxWidth',0.5,'MarkerStyle','x','notch','on');
 ylim([20 100]), ylabel('Temperature (\circF)')
 legend(categorical(unique(data.Year)))
인용 양식
Austin M. Weber (2024). groupedSpacedBoxchart (https://github.com/weber1158/groupedSpacedBoxchart/releases/tag/v0.1.0), GitHub. 검색 날짜: .
MATLAB 릴리스 호환 정보
플랫폼 호환성
Windows macOS Linux태그
Community Treasure Hunt
Find the treasures in MATLAB Central and discover how the community can help you!
Start Hunting!| 버전 | 게시됨 | 릴리스 정보 | |
|---|---|---|---|
| 0.1.0 |


