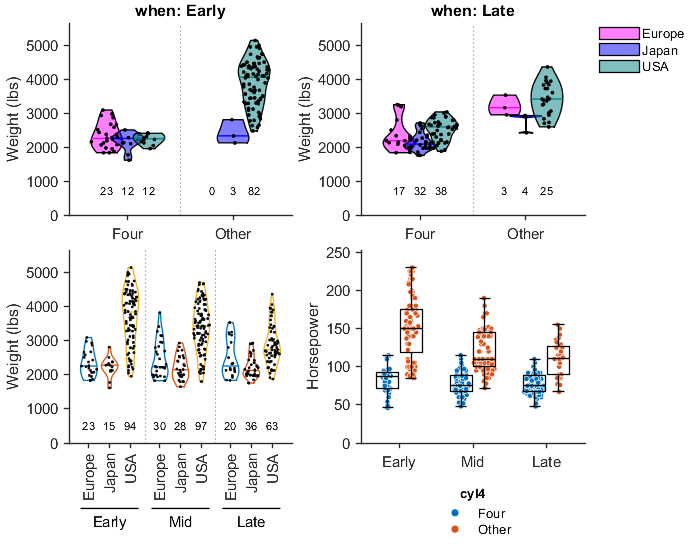
An open-source MATLAB tool for drawing box plot and violin plot with automatic multi-way data grouping.
이 제출물을 팔로우합니다
- 팔로우하는 게시물 피드에서 업데이트를 확인할 수 있습니다
- 정보 수신 기본 설정에 따라 이메일을 받을 수 있습니다
grpandplot: An open-source MATLAB tool for drawing box plot and violin plot with automatic multi-way data grouping.
Man Ho Wong, 2022.
Introduction
grpandplot features data grouping by multiple factors, supporting up to three-way grouping. Different combination of data objects (i.e. scatter (data points, box plot, violin plot, n number) can be plotted on top of each other with size and position automatically adjusted. This function is compatible with MATLAB's plotting syntax and can be combined with other MATLAB Graphics objects, such as Figure, TiledChartLayout and Axes. Moreover, figures are fully configurable with MATLAB's graphics methods and properties.
Features:
- Multi-way data grouping up to three factors
- Data can be grouped and displayed as groups along x-axis, of different colors and/or in separate tiles (i.e. axes) in the same figure
- Available data objects: scatter, box plot, violin plot, n number
- Data points jittered according to their PDF
- Different combinations of data objects allowed
- Size and position of data objects automatically adjusted
- Options available for adjust color, size and position
- Compatible with MATLAB's Graphics objects such as
Figure,TiledChartLayoutandAxes - Figures configurable via MATLAB's graphics methods and properties
Installation
Requirement: MATLAB R2020b or above (Versions supporting swarmchart)
You can download the directory grpandplot directly to you computer or install via MATLAB's Add-On Explorer.
Usage
See documentation (grpandplot_doc.mlx or grpandplot_doc.pdf).
License
This tool contains a modified version of violin.m created by Jasper Fabius (2019). The copyright notice can be found here. Modification is documented in the function file violin.m.
This project is licensed under GNU General Public License v3.0.
Cite As
Wong, M. H. (2022). grpandplot: An open-source MATLAB tool for drawing box plot and violin plot with automatic multi-way data grouping. (Version 1.0.0) [Computer software]. https://doi.org/10.5281/zenodo.7295877
인용 양식
Man Ho Wong (2026). grpandplot (https://github.com/manhowong/grpandplot/releases/tag/v1.0.0), GitHub. 검색 날짜: .
Wong, Man Ho. Grpandplot: An Open-Source MATLAB Tool for Drawing Box Plot and Violin Plot with Automatic Multi-Way Data Grouping. Zenodo, 2022, doi:10.5281/ZENODO.7295877.
일반 정보
- 버전 1.0.0 (2.08 MB)
-
GitHub에서 라이선스 보기
MATLAB 릴리스 호환 정보
- R2021a 이상 릴리스와 호환
플랫폼 호환성
- Windows
- macOS
- Linux
| 버전 | 퍼블리시됨 | 릴리스 정보 | Action |
|---|---|---|---|
| 1.0.0 |

