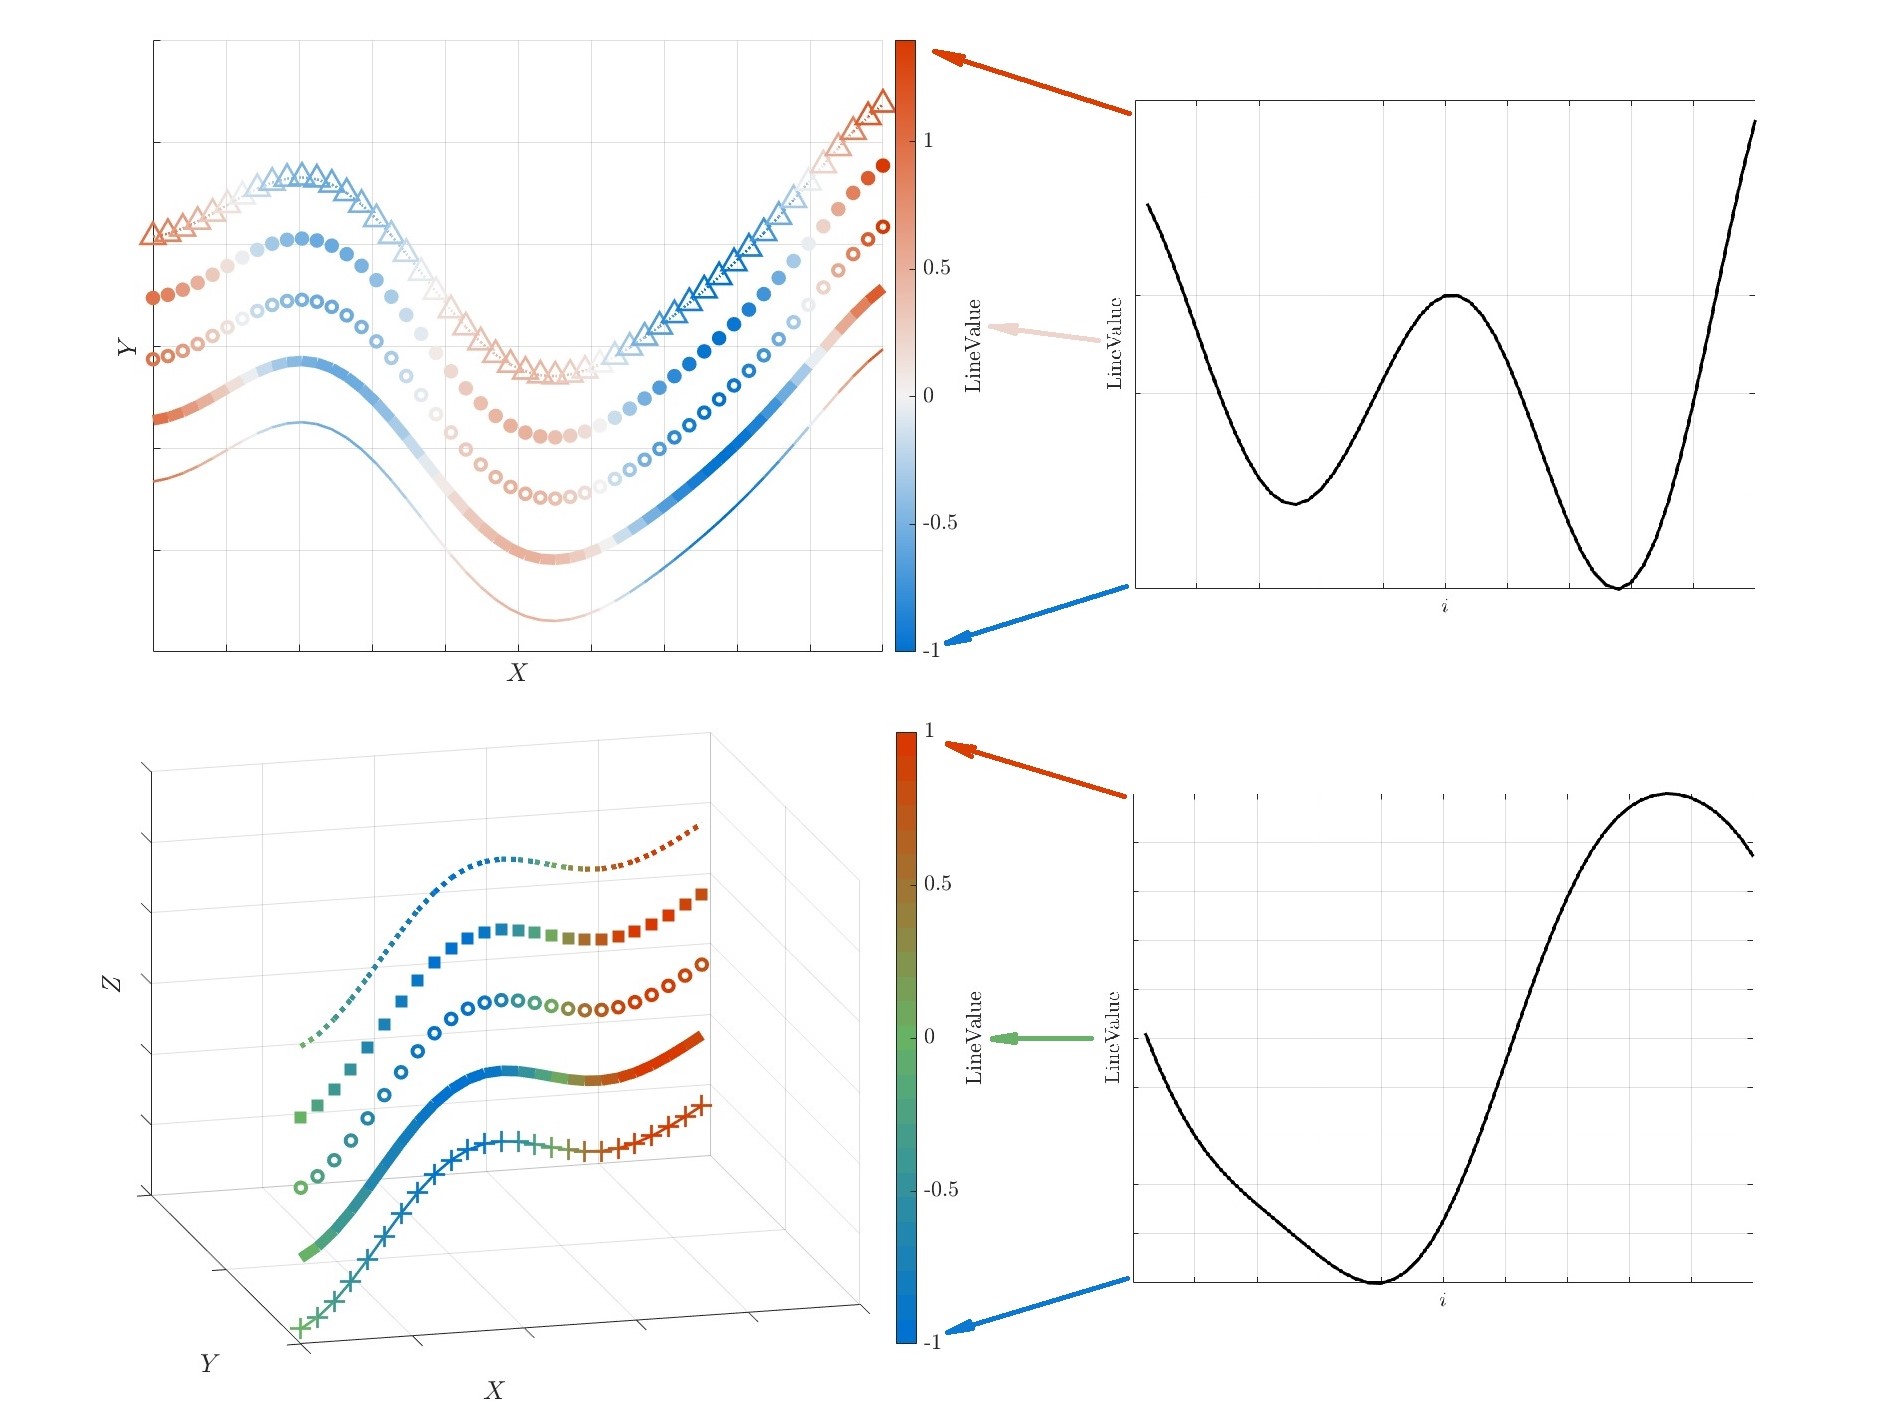
Plot colormapped lines and map values onto lines - plotcmap
Plots a colormapped 2-D or 3-D line that maps the values of another variable onto the colormap on the line. LineSpec available as in >>plot.

이 제출물을 팔로우합니다
- 팔로우하는 게시물 피드에서 업데이트를 확인할 수 있습니다
- 정보 수신 기본 설정에 따라 이메일을 받을 수 있습니다
인용 양식
Xiaowei He (2026). Plot colormapped lines and map values onto lines - plotcmap (https://kr.mathworks.com/matlabcentral/fileexchange/110530-plot-colormapped-lines-and-map-values-onto-lines-plotcmap), MATLAB Central File Exchange. 검색 날짜: .
| 버전 | 퍼블리시됨 | 릴리스 정보 | Action |
|---|---|---|---|
| 1.2.0 | - Added an output argument that displays the colorbar and returns the colorbar handle. E.g., [~, cb] = plotcmap(__). |
||
| 1.1.1 | - Fixed a bug that causes errors when plotting on target axes.
|
||
| 1.1.0 | - Added support for using MATLAB predefined colormaps.
|
||
| 1.0.0 |

