
이 제출물을 팔로우합니다
- 팔로우하는 게시물 피드에서 업데이트를 확인할 수 있습니다
- 정보 수신 기본 설정에 따라 이메일을 받을 수 있습니다
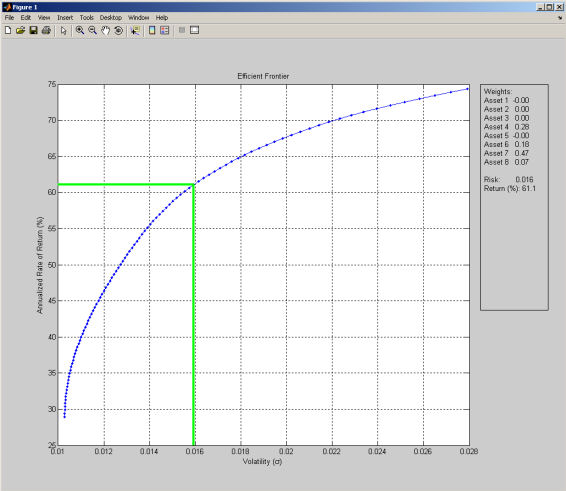
Demonstrates the use of MATLAB's nested functions to create graphical tools with little coding. This example creates an efficient frontier from supplied data (or generates random returns if no inputs are supplied) and then allows the user to move a crosshair along the efficient frontier to view the weights for the selected portfolio.
This example is similar in functionality to "Efficient Frontier GUI" but the code is less intimidating for new users. It invokes the "portopt" function from MATLAB's Financial Toolbox to create the efficient frontier.
인용 양식
Paul Taylor (2026). Interactive Efficient Frontier Viewer (https://kr.mathworks.com/matlabcentral/fileexchange/10949-interactive-efficient-frontier-viewer), MATLAB Central File Exchange. 검색 날짜: .
도움
도움 받은 파일: Efficient Frontier GUI
| 버전 | 퍼블리시됨 | 릴리스 정보 | Action |
|---|---|---|---|
| 1.0.0.0 | Improved description of application. |
