Scalebar
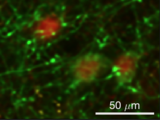
Create a scalebar object for x- and or y-axis. Scalebar appearance is configured on creation, through setting of properties, or interactively using a context menu.
Features
- Option to autoadjust scalebar on zoom.
- Scalebar stays in place on zooming and panning
- Update scalebar size and appearance interactively from contextmenu
- Save scalebar appearance to preferences, so next scalebar created will use same appearance.
- Hide/show semi-transparent background
Example
f = figure();
hAx = axes(f);
imshow('cell.tif', 'Parent', hAx);
pixPerUm = 5;
scalebarLength = 10; % scalebar will be 10 micrometer long
unit = sprintf('%sm', '\mu'); % micrometer
hScalebar = scalebar(hAx, 'x', scalebarLength, unit, 'Location', 'southeast', ...
'ConversionFactor', pixPerUm);
Known Bugs
Scalebar position is not correctly updated when interactive zooming tools are activated and user doubleclicks in axes
인용 양식
Eivind Hennestad (2025). Scalebar for images and plots (https://kr.mathworks.com/matlabcentral/fileexchange/109114-scalebar-for-images-and-plots), MATLAB Central File Exchange. 검색 날짜: .
MATLAB 릴리스 호환 정보
개발 환경:
R2020b
모든 릴리스와 호환
플랫폼 호환성
Windows macOS Linux태그
Community Treasure Hunt
Find the treasures in MATLAB Central and discover how the community can help you!
Start Hunting!| 버전 | 게시됨 | 릴리스 정보 | |
|---|---|---|---|
| 1.0.6 | - Added options for including semi-transparent background
|
||
| 1.0.5 | Update image |
||
| 1.0.4 | Fix potential infinite recursive callback loop |
||
| 1.0.3 | Changed file |
||
| 1.0.2 | Adds to current axes if parent is not specified
|
||
| 1.0.1 | Updated image |
||
| 1.0.0 |

