Spike Raster Plot
버전 1.0.1 (112 KB) 작성자:
Benjamin Kraus
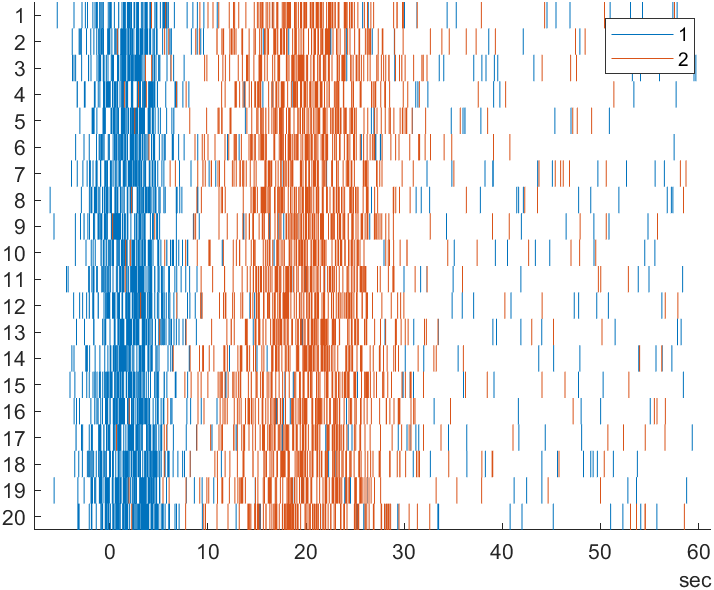
A spike raster plot from spike time stamps with optional trial and group data.
Spike Raster Plot
Version: 1.0
This chart creates a spike raster plot from spike time stamps with optional trial and group data.
Syntax
-
spikeRasterPlot(spikeTimes)create a spike raster plot with the specified spike timestamps. spikeTimes must be a vector of duration values. -
spikeRasterPlot(spikeTimes, trials)create a spike raster plot with the specified trial assignment for each spike time. trials must be a vector of equal length to the spike times and of type categorical or be convertible to categorical. -
spikeRasterPlot()create a spike raster plot using only name-value pairs. -
spikeRasterPlot(___,Name,Value)specifies additional options for the spike raster plot using one or more name-value pair arguments. Specify the options after all other input arguments. -
spikeRasterPlot(parent,___)creates the spike raster plot in the specified parent. -
h = spikeRasterPlot(___)returns the spikeRasterPlot object. Use h to modify properties of the plot after creating it.
Name-Value Pair Arguments/Properties
-
SpikeTimeData(n x 1 duration vector) spike time data. -
TrialData(n x 1 categorical vector) trial assignment of each spike in the SpikeTimeData. -
GroupData(n x 1 categorical vector) group assignment of each spike in the SpikeTimeData. -
AlignmentTimes(n x 1 duration vector) time to use as alignment time for each trial. -
ColorOrder(m x 3 matrix of RGB triplets) list of colors to use for each group. -
XLimits(1 x 2 duration vector) x-limits of the plot. -
XLimitsMode('auto'or 'manual') mode for the x-limits. -
TitleText(n x 1 string vector) title of the plot. -
SubtitleText(n x 1 string vector) subtitle of the plot. -
XLabelText(n x 1 string vector) x-label of the plot. -
YLabelText(n x 1 string vector) y-label of the plot. -
LegendVisible(scalarmatlab.lang.OnOffSwitchState) display the legend or not. -
LegendTitle(n x 1 string vector) title on the legend.
Example
Create a spike raster plot using generated by the helper script createExampleData.
[spiketimes, trials, groups, trialStarts] = createExampleData;
s = spikeRasterPlot(spiketimes, trials, 'GroupData', groups);
s.AlignmentTimes = trialStarts;
s.LegendTitle = 'neuron';
ylabel('Lap')
인용 양식
Benjamin Kraus (2024). Spike Raster Plot (https://github.com/MATLAB-Graphics-and-App-Building/spike-raster-plot/releases/tag/v1.0.1), GitHub. 검색 날짜: .
MATLAB 릴리스 호환 정보
개발 환경:
R2021b
R2020b 이상 릴리스와 호환
플랫폼 호환성
Windows macOS Linux카테고리
Help Center 및 MATLAB Answers에서 Electrophysiology에 대해 자세히 알아보기
태그
Community Treasure Hunt
Find the treasures in MATLAB Central and discover how the community can help you!
Start Hunting!| 버전 | 게시됨 | 릴리스 정보 | |
|---|---|---|---|
| 1.0.1 | See release notes for this release on GitHub: https://github.com/MATLAB-Graphics-and-App-Building/spike-raster-plot/releases/tag/v1.0.1 |
||
| 1.0 |
이 GitHub 애드온의 문제를 보거나 보고하려면 GitHub 리포지토리로 가십시오.
이 GitHub 애드온의 문제를 보거나 보고하려면 GitHub 리포지토리로 가십시오.


