Given two vectors t and y, make a plot containing a blue ( b ) dashed ( -- ) line of y versus t.
Mark the minimum value m of the vector y by adding a point to the plot. This point should be a red asterisk marker, and it must be added after the blue line.
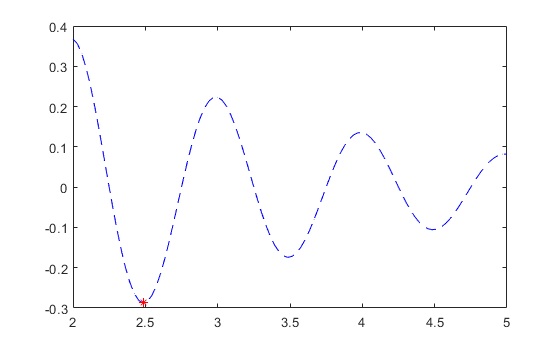
Return the minimum value of y as output m.
Solution Stats
Problem Comments
23 Comments
Solution Comments
Show comments
Loading...
Problem Recent Solvers10703
Suggested Problems
-
16236 Solvers
-
Determine the number of odd integers in a vector
850 Solvers
-
Given a matrix, swap the 2nd & 3rd columns
1283 Solvers
-
2101 Solvers
-
341 Solvers
More from this Author13
Problem Tags
Community Treasure Hunt
Find the treasures in MATLAB Central and discover how the community can help you!
Start Hunting!
hi, I do not understand why when a submit my code i get an error, it said "check data".
Mohamed, the check plotted data error suggests that the data you are plotting in the plot command does not match the data you are expected to plot i.e. your y and m variables. The red star marker must be on the minimum value of any given input signal y.
I kept getting an error plotting star with both 'p' and 'h', it only accepted the code when I changed it to an asterisk '*'. please modify the question to made it more understandable.
Thanks Ian for pointing out the error. I have updated the description to use the appropriate name for the marker.
Even without plotting the graph ploblem is getting solved and accepted. So, there is no point in comparing our solution witht the leading solution!
Omkar- Thanks for pointing out the issue with the test suite. I have modified messages to errors when the solution has no plot or too many plots. The solutions will be rescored.
I put this code in my desktop Matlab and the plot looks fine, but Cody says it's wrong. Can someone give me a hint?
function plot_cos(y, t)
t = linspace(0,15,400);
[val,i]=min(exp(-0.5*t).*cos(2*pi.*t));
plot(t,(exp(-0.5*t).*cos(2*pi.*t)),'b--',t(i),val,'r*')
end
my solution is accepted but the feedback is broken. I get this message.
"We're sorry, but something went wrong.We've been notified about this issue and we'll take a look at it shortly."
I received the same msg as Jimmy although my code was accepted: "We're sorry, but something went wrong.We've been notified about this issue and we'll take a look at it shortly."
I have tried with below command,but its not working.Kindly suggest some hints.
function m = plot_cos(y, t)
plot(m(min),"r * ") ;
end
Good problem
I has a problem here and i dont understand its mean
Undefined function 'minus' for input arguments of type 'matlab.graphics.chart.primitive.Line'. Error in Test1 (line 6) assert(abs(m - (-0.781239288889930)) <= 1e-4)
a very challenging and good problem
This problem description is problematic, and do is the test suite code as many have pointed out.
tip/hint: don't use 'scatter' function to plot the minimum asterisk marker as I did, test suite only accepts 'plot' for a a dum(b)p reason (pun intended *)
Took me forever but I finally got it :)
Shouldn't the tests under the Test Suite run automatically when you put your trial function on the scratch pad. It worked previously and now it does not. Not sure what I'm doing wrong here.
The problem description should be: tinker with your perfectly valid code until the shoddy testing routines are satisfierd with your results. Does not recognise scatter as a part of the solution.
watch out! You also have to output the minimum value
I agree with some comments regarding what doing with m, but finally I got it. But It's impossible to pass test because it does not recognize "blue" "b" or LineStyle double dash "---"
It's a good question to solve
It should accept scatter as a plot for the minimum value of y haha
Substandard wording.
mama mia