How do you manually calculate the damping and frequency? Is there a mathematical formula? What type of nonlinear fit do you want to fit your data?
Damping and frequency from simulation data
조회 수: 35 (최근 30일)
이전 댓글 표시
I have some simulation data, for example y in the attachment. I can manually calculate the damping and frequency with logarithmic decrement, but can I do this automated? I can't seem to figure out how.
And/or can I fit a nonlinear function through my datapoints? I tried polyfit but that doesn't work with time series.
댓글 수: 2
MM
2020년 4월 3일
I calculated it like they did here:
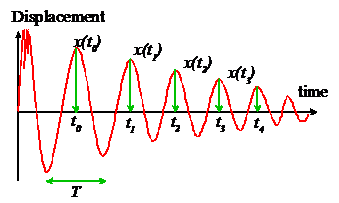
With damping: 
And frequency: 
What type of nonlinear fit? I don't know, any that will work. I was hoping a fit would maybe let me help to calculate the frequency and daming ratio
답변 (1개)
Ameer Hamza
2020년 4월 3일
The following code automatically estimate the parameters from the signal.
load('PositionY_example.mat');
[val, locs] = findpeaks(y.Data);
peak_times = y.Time(locs);
t0 = t(locs(1));
tn = t(locs(2:end));
omega = mean((1:numel(tn))'./(tn-t0));
xt0 = val(1);
xtn = val(2:end);
delta = mean(log(xtn./xt0)./(1:numel(xtn))');
zeta = delta/sqrt(4*pi^2+delta^2);
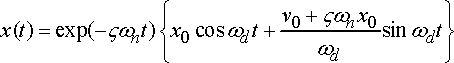
As you already know the value of ω, δ, and ζ of your signal, you can calculate the nonlinear fit for your data using this equation.
댓글 수: 2
MD Riaz Pervez
2023년 4월 28일
t represent time. Here use t=Time therefore change that to make a single
참고 항목
카테고리
Help Center 및 File Exchange에서 Sources에 대해 자세히 알아보기
Community Treasure Hunt
Find the treasures in MATLAB Central and discover how the community can help you!
Start Hunting!
Translated by ![]()
또한 다음 목록에서 웹사이트를 선택하실 수도 있습니다.
미주
- América Latina (Español)
- Canada (English)
- United States (English)
유럽
- Belgium (English)
- Denmark (English)
- Deutschland (Deutsch)
- España (Español)
- Finland (English)
- France (Français)
- Ireland (English)
- Italia (Italiano)
- Luxembourg (English)
- Netherlands (English)
- Norway (English)
- Österreich (Deutsch)
- Portugal (English)
- Sweden (English)
- Switzerland
- United Kingdom (English)
아시아 태평양
- Australia (English)
- India (English)
- New Zealand (English)
- 中国
- 日本Japanese (日本語)
- 한국Korean (한국어)