
Plotting Two Data Sets on a Figure
조회 수: 6 (최근 30일)
이전 댓글 표시
I have two sets of data which can be plotted as a sets of discrete points given by (x,y) coordinates on a 2D plot. Is there some way that I can manually plot both sets of points, join the points to have two separate curves for the two data sets and then have a legend corresponding to the points used for the plotting? If easier, I could enter the data sets as arrays by creating the matrix and then plotting from it.
I did something similar before in this case it was something like a scatter diagram whereas here I need to join the points.
댓글 수: 0
채택된 답변
Cris LaPierre
2020년 3월 24일
Something like this?

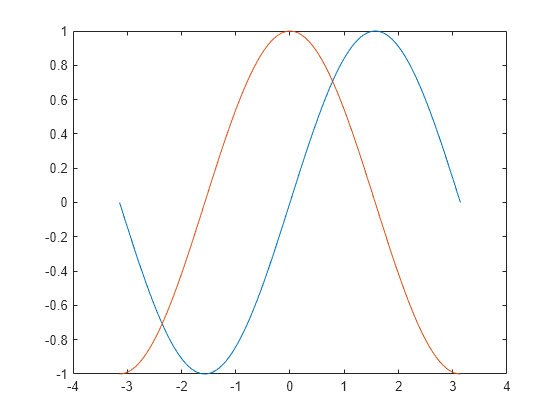
x = linspace(-pi,pi);
y1 = sin(x);
plot(x,y1)
hold on
y2 = cos(x);
plot(x,y2)
hold off
댓글 수: 10
Cris LaPierre
2020년 4월 3일
Bad example. Sorry. Yes, line styles don't apply if you are plotting the points one at a time. You'll need to use a marker. Check out the link I shared. That shows you the available marker styles.
추가 답변 (0개)
참고 항목
카테고리
Help Center 및 File Exchange에서 Legend에 대해 자세히 알아보기
Community Treasure Hunt
Find the treasures in MATLAB Central and discover how the community can help you!
Start Hunting!
