Continuous Wavelet Analysis of Cusp Signal
This example shows how to perform continuous wavelet analysis of a cusp signal. You can use cwt for analysis using an analytic wavelet and wtmm to isolate and characterized singularities.
Load and plot a cusp signal. Display its definition at the command line.
load cuspamax;
plot(cuspamax); grid on;
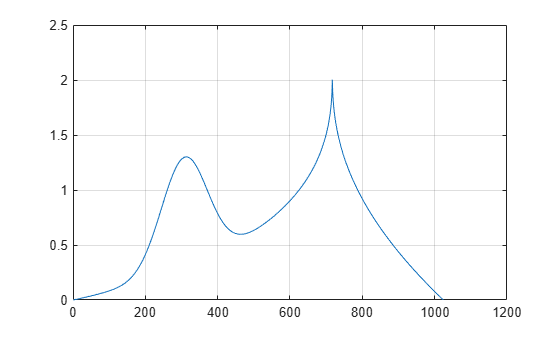
disp(caption)
x = linspace(0,1,1024); y = exp(-128*((x-0.3).^2))-3*(abs(x-0.7).^0.4);
Obtain and view the CWT of the cusp signal. The CWT uses an analytic Morse wavelet with gamma equal to 2 and a time-bandwidth parameter of 2.5. Notice the narrow region in the scalogram converging to the finest scale (highest frequency). This indicates a discontinuity in the signal.
cwt(cuspamax,'WaveletParameters',[2 2.5]);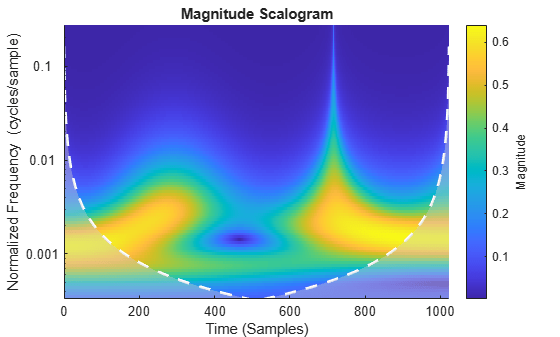
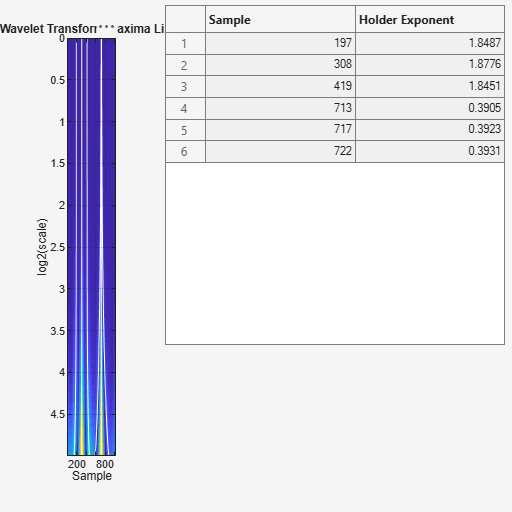
Obtain a plot of the wavelet maxima lines using wavelet transform modulus maxima. wtmm returns estimates of the Holder exponents, which characterize isolated singularities in a signal. Notice that the cusp is shown very clearly using wtmm.
wtmm(cuspamax,'ScalingExponent','local');