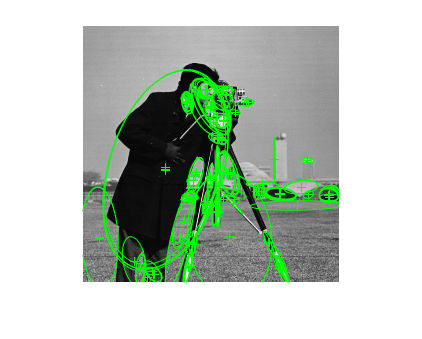
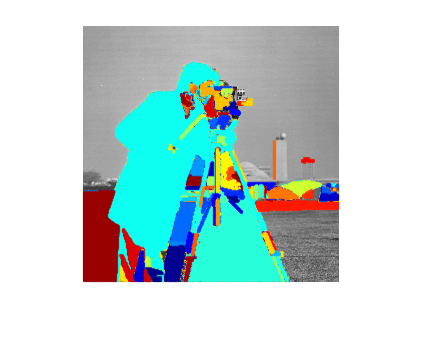
plot
Plot MSER regions
Description
plot(
specifies options using one or more name-value arguments in addition to any combination of
arguments from previous syntaxes. For example,
points,ax,Name=Value)plot(points,ax,ShowOrientation=true) sets the logical value to true to
show the orientation.
Examples
Input Arguments
Name-Value Arguments
Version History
Introduced in R2012a

