워드 클라우드를 사용하여 텍스트 데이터 시각화하기
이 예제에서는 워드 클라우드를 사용하여 텍스트 데이터를 시각화하는 방법을 보여줍니다.
Text Analytics Toolbox에서는 wordcloud(MATLAB) 함수의 기능을 확장해 사용할 수 있습니다. 또한 string형 배열에서 직접 워드 클라우드를 만들고 bag-of-words 모델 및 LDA 토픽에서도 워드 클라우드를 만들 수 있습니다.
예제 데이터를 불러옵니다. factoryReports.csv 파일에는 각 이벤트에 대한 텍스트 설명과 범주 레이블이 포함된 공장 보고서가 들어 있습니다.
filename = "factoryReports.csv";
tbl = readtable(filename,'TextType','string');
Description 열에서 텍스트 데이터를 추출합니다.
textData = tbl.Description;
textData(1:10)
ans = 10×1 string array
    "Items are occasionally getting stuck in the scanner spools."
    "Loud rattling and banging sounds are coming from assembler pistons."
    "There are cuts to the power when starting the plant."
    "Fried capacitors in the assembler."
    "Mixer tripped the fuses."
    "Burst pipe in the constructing agent is spraying coolant."
    "A fuse is blown in the mixer."
    "Things continue to tumble off of the belt."
    "Falling items from the conveyor belt."
    "The scanner reel is split, it will soon begin to curve."
보고서에서 워드 클라우드를 만듭니다.
figure
wordcloud(textData);
title("Factory Reports")
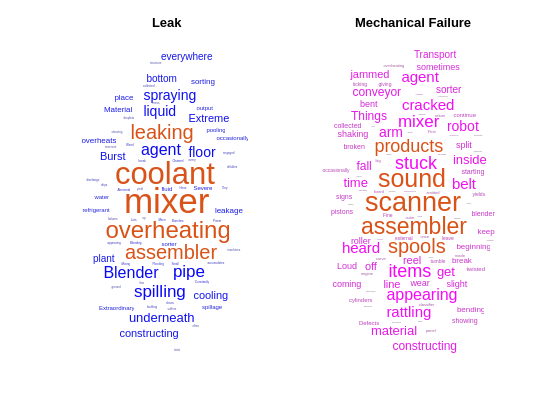
보고서에서 레이블 "Leak" 및 "Mechanical Failure"를 갖는 단어를 비교합니다. 이러한 각 레이블에 대해 보고서의 워드 클라우드를 만듭니다. 각 워드 클라우드의 단어 색을 각각 파란색과 자홍색으로 지정합니다.
figure
labels = tbl.Category;

subplot(1,2,1)
idx = labels == "Leak";
wordcloud(textData(idx),'Color','blue');
title("Leak")

subplot(1,2,2)
idx = labels == "Mechanical Failure";
wordcloud(textData(idx),'Color','magenta');
title("Mechanical Failure")
보고서에서 Urgency "Low", "Medium", "High"를 갖는 단어를 비교합니다.
figure
urgency = tbl.Urgency;

subplot(1,3,1)
idx = urgency == "Low";
wordcloud(textData(idx));
title("Urgency: Low")

subplot(1,3,2)
idx = urgency == "Medium";
wordcloud(textData(idx));
title("Urgency: Medium")

subplot(1,3,3)
idx = urgency == "High";
wordcloud(textData(idx));
title("Urgency: High")

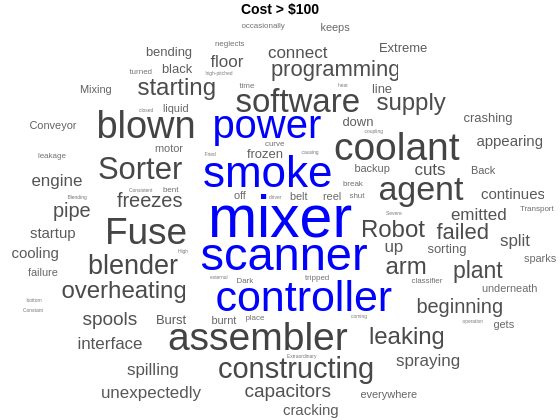
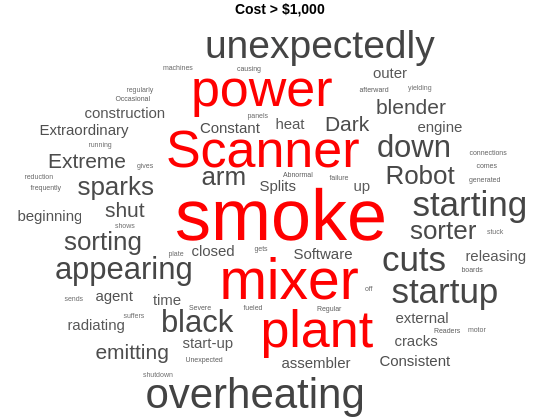
수백 달러로 보고된 비용을 갖는 보고서의 단어와 수천 달러로 보고된 비용을 갖는 보고서를 비교합니다. 이러한 각 금액에 대해 보고서의 워드 클라우드를 만들고 각각 파란색과 빨간색으로 강조합니다.
cost = tbl.Cost;
idx = cost > 100;
figure
wordcloud(textData(idx),'HighlightColor','blue');
title("Cost > $100")
idx = cost > 1000;
figure
wordcloud(textData(idx),'HighlightColor','red');
title("Cost > $1,000")
참고 항목
wordcloud | tokenizedDocument | bagOfWords