fsurf
R2026b3차원 곡면 플로팅
구문
설명
fsurf(는 f,[xmin xmax ymin ymax])x의 구간 [xmin xmax] 및 y의 구간 [ymin ymax]에 f(x,y)를 플로팅합니다. fsurf 함수는 symvar을 사용하여 변수의 순서를 정렬하고 구간을 할당합니다.
fsurf(는 funx,funy,funz)u와 v의 구간 [-5 5]에 파라미터 곡면 x = x(u,v), y = y(u,v), z = z(u,v)를 플로팅합니다.
fsurf(는 funx,funy,funz,[uvmin uvmax])u와 v의 구간 [uvmin uvmax]에 파라미터 곡면 x = x(u,v), y = y(u,v), z = z(u,v)를 플로팅합니다.
fsurf(는 funx,funy,funz,[umin umax vmin vmax])u의 구간 [umin umax] 및 v의 구간 [vmin vmax]에 파라미터 곡면 x = x(u,v), y = y(u,v), z = z(u,v)를 플로팅합니다. fsurf 함수는 symvar을 사용하여 파라미터 변수의 순서를 정렬하고 구간을 할당합니다.
fsurf(___,은 LineSpec)LineSpec을 사용하여 선 스타일, 마커 기호, 면 색을 설정합니다. 위에 나와 있는 입력 인수의 조합 다음에 이 옵션을 사용하십시오.
fsurf(___,는 하나 이상의 이름-값 인수를 사용하여 line 속성을 지정합니다. 위에 열거된 구문에 나와 있는 입력 인수의 조합 다음에 이 옵션을 사용하십시오.Name=Value)
fsurf(는 현재 axes 객체 ax,___)gca 대신 객체 ax로 지정된 좌표축에 플로팅합니다.
fs = fsurf(___)
예제
디폴트 범위 와 에 입력값 를 플로팅합니다.
syms x y
fsurf(sin(x)+cos(y))
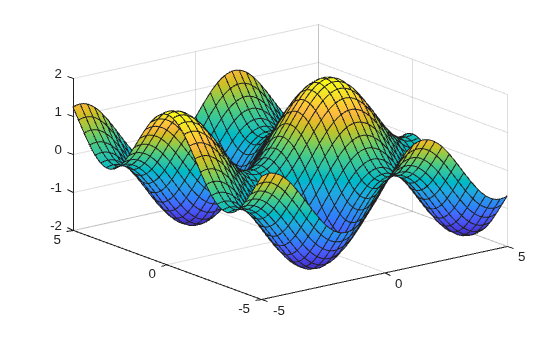
디폴트 범위 와 에 의 실수부를 플로팅합니다.
syms f(x,y)
f(x,y) = real(atan(x + i*y));
fsurf(f)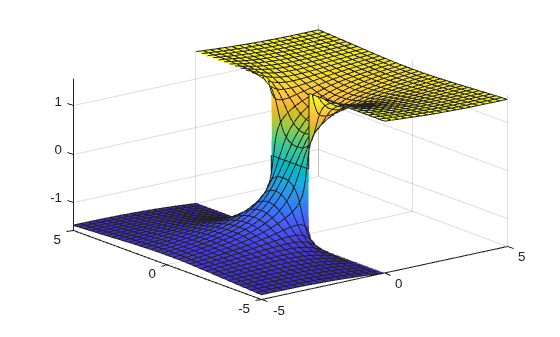
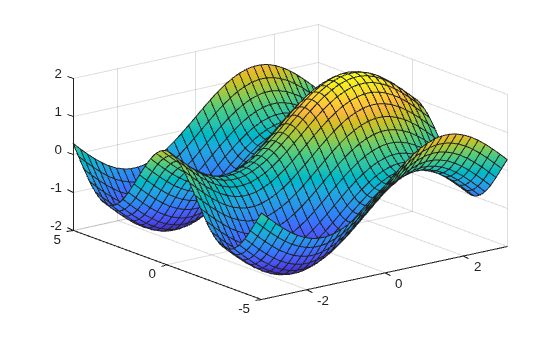
플로팅 구간을 fsurf의 두 번째 인수로 지정하여 와 에 를 플로팅합니다.
syms x y
f = sin(x) + cos(y);
fsurf(f, [-pi pi -5 5])
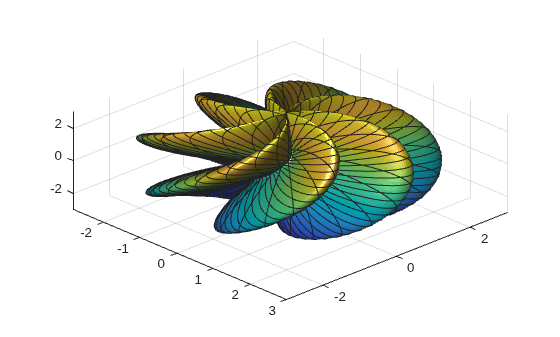
파라미터화된 곡면을 플로팅합니다.
범위는 와 입니다.
camlight를 사용하여 플롯의 모양을 개선합니다.
syms s t
r = 2 + sin(7*s + 5*t);
x = r*cos(s)*sin(t);
y = r*sin(s)*sin(t);
z = r*cos(t);
fsurf(x, y, z, [0 2*pi 0 pi])
camlight
view(46,52)
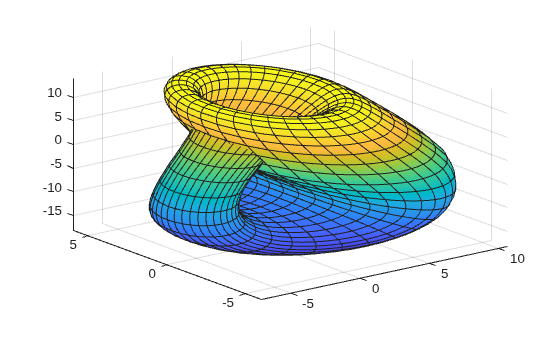
클라인 병의 조각별 표현식을 플로팅합니다.
범위는 와 입니다.
클라인 병에는 한 쪽 곡면만 있음을 보여줍니다.
syms u v;
r = @(u) 4 - 2*cos(u);
x = piecewise(u <= pi, -4*cos(u)*(1+sin(u)) - r(u)*cos(u)*cos(v),...
    u > pi, -4*cos(u)*(1+sin(u)) + r(u)*cos(v));
y = r(u)*sin(v);
z = piecewise(u <= pi, -14*sin(u) - r(u)*sin(u)*cos(v),...
    u > pi, -14*sin(u));
h = fsurf(x,y,z, [0 2*pi 0 2*pi]);
와 에 대해 에서 까지 3차원 곡면 를 플로팅합니다. 제목과 축 레이블을 추가합니다.
pi/2 간격으로 x축 제한 범위 내에 x축 눈금을 만듭니다. round를 사용하여 축 제한을 pi/2의 정확한 배수로 변환하고 기호 눈금 값을 S로 가져옵니다. XTick 속성을 사용하여 이러한 눈금을 표시합니다. texlabel을 S에 적용하도록 arrayfun을 사용하여 x축 레이블을 만듭니다. XTickLabel 속성을 사용하여 이러한 레이블을 표시합니다. y축에 대해 위 단계를 반복합니다.
플롯에서 LaTeX을 사용하려면 latex 항목을 참조하십시오.
syms x y
fsurf(y.*sin(x)-x.*cos(y), [-2*pi 2*pi])
title('ysin(x) - xcos(y) for x and y in [-2\pi,2\pi]')
xlabel('x')
ylabel('y')
zlabel('z')

ax = gca;
S = sym(ax.XLim(1):pi/2:ax.XLim(2));
S = sym(round(vpa(S/pi*2))*pi/2);
ax.XTick = double(S);
ax.XTickLabel = arrayfun(@texlabel,S,UniformOutput=false);

S = sym(ax.YLim(1):pi/2:ax.YLim(2));
S = sym(round(vpa(S/pi*2))*pi/2);
ax.YTick = double(S);
ax.YTickLabel = arrayfun(@texlabel,S,UniformOutput=false);
![Figure contains an axes object. The axes object with title ysin(x) - xcos(y) for x and y in [- 2 pi , 2 pi ], xlabel x, ylabel y contains an object of type functionsurface.](../examples/symbolic/AddTitleAndAxisLabelsAndFormatTicksExample_01.png)
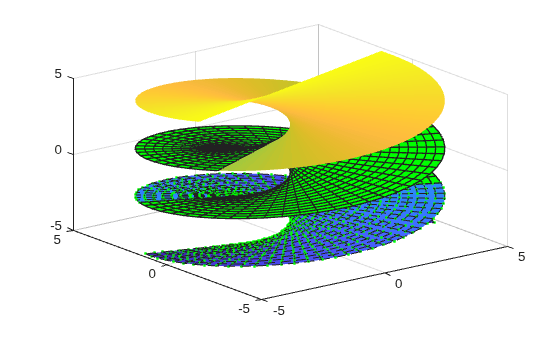
의 다양한 값에 대해 각기 다른 선 스타일을 사용하여 파라미터 곡면 , , 를 플로팅합니다. 의 경우, 녹색 점 마커가 있는 파선을 사용합니다. 의 경우 LineWidth 1과 녹색 면 색을 사용합니다. 의 경우, EdgeColor를 none으로 설정하여 선을 제거합니다.
syms s t
fsurf(s*sin(t),-s*cos(t),t,[-5 5 -5 -2],'--.',MarkerEdgeColor='g')
hold on
fsurf(s*sin(t),-s*cos(t),t,[-5 5 -2 2],LineWidth=1,FaceColor='g')
fsurf(s*sin(t),-s*cos(t),t,[-5 5 2 5],EdgeColor='none')
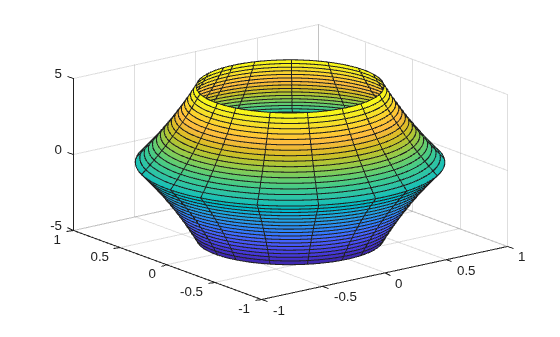
다음 파라미터 곡면을 플로팅합니다.
fcontour가 plot 객체를 반환하도록 출력값을 지정합니다.
syms u v
x = exp(-abs(u)/10).*sin(5*abs(v));
y = exp(-abs(u)/10).*cos(5*abs(v));
z = u;
fs = fsurf(x,y,z)
fs =
  ParameterizedFunctionSurface with properties:

    XFunction: exp(-abs(u)/10)*sin(5*abs(v))
    YFunction: exp(-abs(u)/10)*cos(5*abs(v))
    ZFunction: u
    EdgeColor: [0.1294 0.1294 0.1294]
    LineStyle: '-'
    FaceColor: 'interp'

  Show all properties
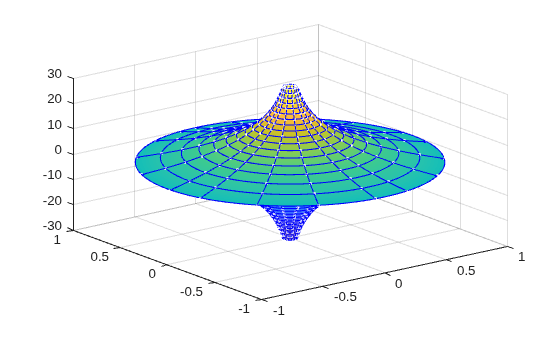
fs의 URange 속성을 사용하여 u의 범위를 [-30 30]으로 변경합니다. EdgeColor 속성을 사용하여 선 색을 파란색으로 설정하고, Marker 속성과 MarkerEdgeColor 속성을 사용하여 흰색 점 마커를 지정합니다.
fs.URange = [-30 30];
fs.EdgeColor = 'b';
fs.Marker = '.';
fs.MarkerEdgeColor = 'w';
fsurf에 대한 벡터 입력값을 사용하여 여러 곡면을 플로팅합니다. 또는 hold on을 사용하여 동일한 Figure에 연속해서 플로팅합니다. 동일한 Figure에 여러 곡면을 표시할 때는 투명도가 유용합니다. FaceAlpha 속성을 사용하여 곡면 플롯의 투명도를 조정합니다. FaceAlpha는 0부터 1까지의 값을 갖습니다. 값이 0이면 완전히 투명하고 1이면 불투명합니다.
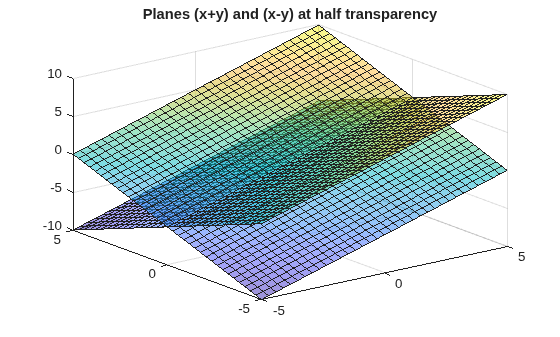
fsurf에 대한 벡터 입력값을 사용하여 평면 와 를 플로팅합니다. FaceAlpha를 사용하여 두 평면을 반투명으로 만들어서 둘 다 표시합니다.
syms x y
h = fsurf([x+y x-y]);
h(1).FaceAlpha = 0.5;
h(2).FaceAlpha = 0.5;
title('Planes (x+y) and (x-y) at half transparency')
MeshDensity 옵션을 사용하여 곡면 플롯의 해상도를 제어합니다. MeshDensity 값을 키우면 더욱 부드럽고 정확한 플롯을 만들 수 있으며, 줄이면 플로팅 속도를 높일 수 있습니다.
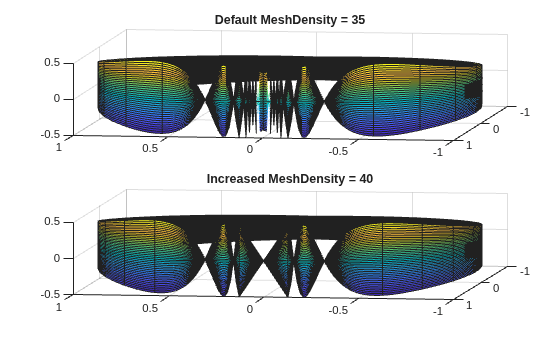
subplot을 사용하여 Figure를 두 개로 나눕니다. 첫 번째 서브플롯에 파라미터 곡면 , , 을 플로팅합니다. 곡면에 큰 간격이 있습니다. 두 번째 서브플롯에서 MeshDensity를 40으로 늘려 이 문제를 수정하십시오. fsurf는 간격을 채우며, 이를 통해 MeshDensity 값을 늘리면 플롯의 해상도가 증가함을 알 수 있습니다.
syms s t

subplot(2,1,1)
fsurf(sin(s), cos(s), t/10.*sin(1./s))
view(-172,25)
title('Default MeshDensity = 35')

subplot(2,1,2)
fsurf(sin(s), cos(s), t/10.*sin(1./s),MeshDensity=40)
view(-172,25)
title('Increased MeshDensity = 40')
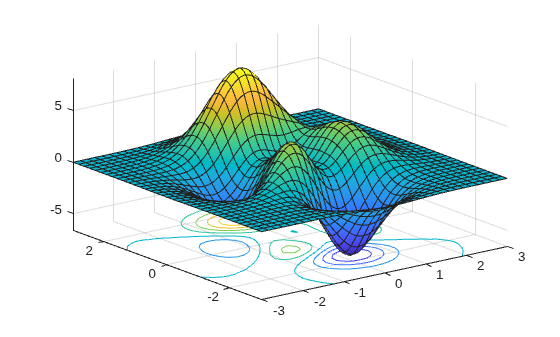
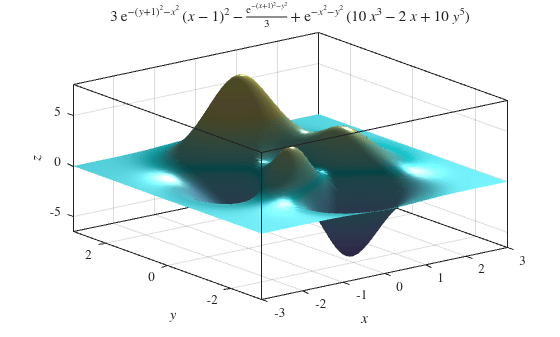
ShowContours 옵션을 'on'으로 설정하여 표현식 f의 곡면 플롯에 대해 등고선을 표시합니다.
syms x y
f = 3*(1-x)^2*exp(-(x^2)-(y+1)^2)...
- 10*(x/5 - x^3 - y^5)*exp(-x^2-y^2)...
- 1/3*exp(-(x+1)^2 - y^2);
fsurf(f,[-3 3],ShowContours='on')
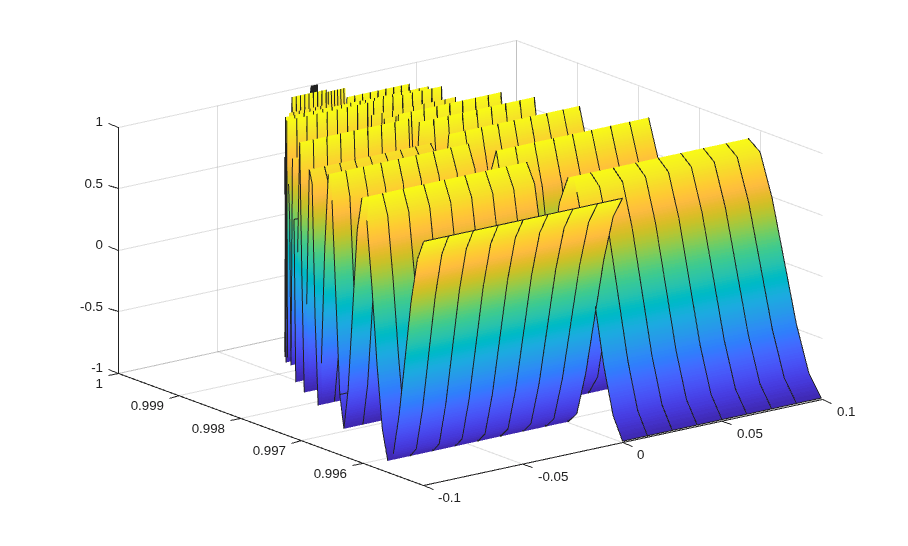
Function 속성, XFunction 속성, YFunction 속성, ZFunction 속성을 사용하여 표시된 표현식을 변경한 다음 drawnow를 통해 플롯을 업데이트하여 곡면 플롯의 애니메이션을 만듭니다. GIF로 내보내려면 imwrite를 참조하십시오.
변수  를 1부터 3까지 변화시키면서 파라미터 곡면에 대한 애니메이션을 표시합니다.


범위는  과
과  입니다.
입니다. MeshDensity를 9로 줄여서 플로팅 속도를 높입니다.
syms s t
h = fsurf(t.*sin(s), cos(s), sin(1./s), [-0.1 0.1 0 1]);
h.MeshDensity = 9;
for i=1:0.1:3
    h.ZFunction = sin(i./s);
    drawnow
end
다음 함수에 대한 기호 표현식 f를 만듭니다.
표현식 f를 곡면으로 플로팅합니다. fsurf에서 반환된 핸들의 속성, 조명 속성 및 colormap을 사용하여 곡면 플롯의 모양을 개선합니다.
camlight를 사용하여 조명을 만듭니다. brighten을 사용하여 밝기를 증가시킵니다. EdgeColor를 'none'으로 설정하여 선을 제거합니다. AmbientStrength를 사용하여 주변광을 증가시킵니다. 자세한 내용은 조명, 투명도, 음영 항목을 참조하십시오. 좌표축 상자를 설정합니다. 제목의 경우, latex을 사용하여 f를 LaTeX으로 변환합니다. 마지막으로, Interpreter를 'latex'으로 설정하여 좌표축 눈금, 좌표축 레이블 및 제목의 모양을 개선합니다.
syms x y
f = 3*(1-x)^2*exp(-(x^2)-(y+1)^2)...
   - 10*(x/5 - x^3 - y^5)*exp(-x^2-y^2)...
   - 1/3*exp(-(x+1)^2 - y^2);
h = fsurf(f,[-3 3]);

camlight(110,70)
brighten(0.6)
h.EdgeColor = 'none';
h.AmbientStrength = 0.4;

a = gca;
a.TickLabelInterpreter = 'latex';
a.Box = 'on';
a.BoxStyle = 'full';

xlabel('$x$',Interpreter='latex')
ylabel('$y$',Interpreter='latex')
zlabel('$z$',Interpreter='latex')
title_latex = ['$' latex(f) '$'];
title(title_latex,Interpreter='latex')
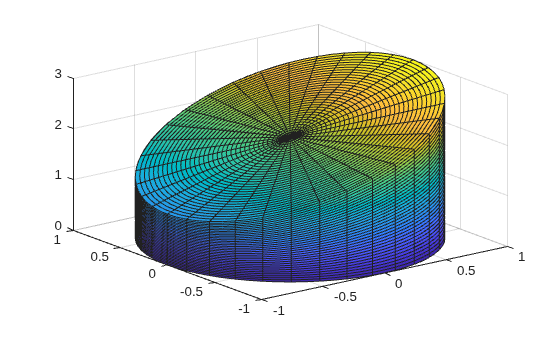
하한은 평면, 상한은 평면인 원통 껍질을 플로팅합니다.
syms r t u
fsurf(cos(t),sin(t),u*(cos(t)+2),[0 2*pi 0 1])
hold on;
평면 의 곡면 플롯을 추가합니다.
fsurf(r*cos(t),r*sin(t),r*cos(t)+2,[0 1 0 2*pi])
원환면의 곡면 플롯에 회전과 평행 이동을 적용합니다.
원환면은 다음과 같이 파라미터로 정의할 수 있습니다.
여기서,
는 편각이고 는 방위각입니다.
는 관의 반지름입니다.
은 관의 중심에서 원환면의 중심까지의 거리입니다.
와 의 값을 각각 1과 5로 정의합니다. fsurf를 사용하여 원환면을 플로팅합니다.
syms theta phi
a = 1;
R = 4;
x = (R + a*cos(theta))*cos(phi);
y = (R + a*cos(theta))*sin(phi);
z = a*sin(theta);
fsurf(x,y,z,[0 2*pi 0 2*pi])
hold on
축을 중심으로 원환면에 회전을 적용합니다. 회전 행렬을 정의합니다. 원환면을 90도( 라디안) 회전합니다.
alpha = pi/2;
Rx = [1 0 0;
      0 cos(alpha) -sin(alpha);
      0 sin(alpha) cos(alpha)];
r = [x; y; z];
r_90 = Rx*r;축을 따라 원환면의 중심을 5만큼 이동합니다. 기존 그래프에 회전 및 평행 이동된 원환면의 두 번째 플롯을 추가합니다.
fsurf(r_90(1)+5,r_90(2),r_90(3))
axis([-5 10 -5 10 -5 5])
hold off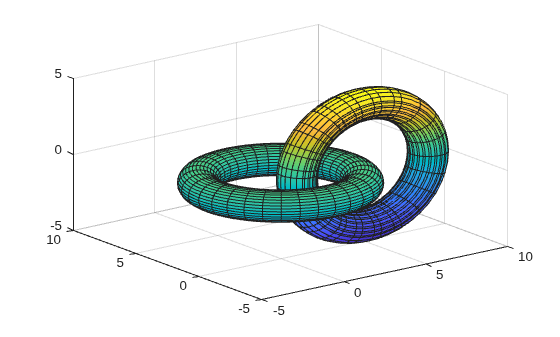
입력 인수
플로팅할 표현식 또는 함수로, 기호 표현식 또는 기호 함수로 지정됩니다.
x축과 y축의 플로팅 구간으로, 숫자 2개로 구성된 벡터로 지정됩니다. 디폴트 값은 [-5 5]입니다.
x축과 y축의 플로팅 구간으로, 숫자 4개로 구성된 벡터로 지정됩니다. 디폴트 값은 [-5 5 -5 5]입니다.
u와 v의 파라미터 함수로, 기호 표현식 또는 기호 함수로 지정됩니다.
u축과 v축의 플로팅 구간으로, 숫자 2개로 구성된 벡터로 지정됩니다. 디폴트 값은 [-5 5]입니다.
u와 v의 플로팅 구간으로, 숫자 4개로 구성된 벡터로 지정됩니다. 디폴트 값은 [-5 5 -5 5]입니다.
axes 객체입니다. axes 객체를 지정하지 않으면 fsurf는 현재 좌표축을 사용합니다.
선 스타일, 마커, 색으로, 기호가 포함된 string형 스칼라 또는 문자형 벡터로 지정됩니다. 기호는 어떤 순서로 지정해도 좋습니다. 세 가지 특성(선 스타일, 마커, 색)을 모두 지정할 필요는 없습니다. 예를 들어, 선 스타일을 생략하고 마커를 지정하면 플롯은 마커만 표시하고 선은 표시하지 않습니다.
예: "--or"는 원 마커로 표시된 빨간색 파선입니다.
| 선 스타일 | 설명 | 결과 선 |
|---|---|---|
"-" | 실선 |
|
"--" | 파선 |
|
":" | 점선 |
|
"-." | 일점 쇄선 |
|


| 마커 | 설명 | 결과 마커 |
|---|---|---|
"o" | 원 |
|
"+" | 플러스 기호 |
|
"*" | 별표 |
|
"." | 점 |
|
"x" | 십자 |
|
"_" | 가로선 |
|
"|" | 세로선 |
|
"square" | 정사각형 |
|
"diamond" | 다이아몬드 |
|
"^" | 위쪽 방향 삼각형 |
|
"v" | 아래쪽 방향 삼각형 |
|
">" | 오른쪽 방향 삼각형 |
|
"<" | 왼쪽 방향 삼각형 |
|
"pentagram" | 펜타그램 |
|
"hexagram" | 헥사그램 |
|


| 색 이름 | 짧은 이름 | RGB 3색 | 모양 |
|---|---|---|---|
"red" | "r" | [1 0 0] |
|
"green" | "g" | [0 1 0] |
|
"blue" | "b" | [0 0 1] |
|
"cyan" | "c" | [0 1 1] |
|
"magenta" | "m" | [1 0 1] |
|
"yellow" | "y" | [1 1 0] |
|
"black" | "k" | [0 0 0] |
|
"white" | "w" | [1 1 1] |
|








이름-값 인수
선택적 인수 쌍을 Name1=Value1,...,NameN=ValueN으로 지정합니다. 여기서 Name은 인수 이름이고 Value는 대응값입니다. 이름-값 인수는 다른 인수 뒤에 와야 하지만, 인수 쌍의 순서는 상관없습니다.
예: Marker='o',MarkerFaceColor='red'
여기에 나와 있는 속성은 일부에 불과합니다. 전체 목록은 FunctionSurface 속성를 참조하십시오.
다음 표에는 라이트 테마와 다크 테마에서 플롯의 디폴트 색 팔레트가 나열되어 있습니다.
| 팔레트 | 팔레트 색 |
|---|---|
R2025a 이전: 대부분의 플롯이 기본적으로 이 색상을 사용합니다. |
|
|
|


orderedcolors 및 rgb2hex 함수를 사용하여 이 팔레트의 RGB 3색 및 16진수 색 코드를 구할 수 있습니다. 예를 들어, "gem" 팔레트의 RGB 3색을 구한 다음 16진수 색 코드로 변환합니다.
RGB = orderedcolors("gem");
H = rgb2hex(RGB);
R2024a 이전: H = compose("#%02X%02X%02X",round(RGB*255))를 사용하여 16진수 색 코드를 구합니다.
R2023b 이전: RGB = get(groot,"FactoryAxesColorOrder")를 사용하여 RGB 3색을 구합니다.
선 스타일로, 다음 표에 나열된 옵션 중 하나로 지정됩니다.
| 선 스타일 | 설명 | 결과 선 |
|---|---|---|
"-" | 실선 |
|
"--" | 파선 |
|
":" | 점선 |
|
"-." | 일점 쇄선 |
|
"none" | 선 없음 | 선 없음 |
마커 기호로, 다음 표에 나열된 값 중 하나로 지정됩니다. 기본적으로 객체는 마커를 표시하지 않습니다. 마커 기호를 지정하면 각 데이터 점이나 꼭짓점에 마커가 추가됩니다.
| 마커 | 설명 | 결과 마커 |
|---|---|---|
"o" | 원 |
|
"+" | 플러스 기호 |
|
"*" | 별표 |
|
"." | 점 |
|
"x" | 십자 |
|
"_" | 가로선 |
|
"|" | 세로선 |
|
"square" | 정사각형 |
|
"diamond" | 다이아몬드 |
|
"^" | 위쪽 방향 삼각형 |
|
"v" | 아래쪽 방향 삼각형 |
|
">" | 오른쪽 방향 삼각형 |
|
"<" | 왼쪽 방향 삼각형 |
|
"pentagram" | 펜타그램 |
|
"hexagram" | 헥사그램 |
|
"none" | 마커 없음 | 해당 없음 |
다음 표에는 라이트 테마와 다크 테마에서 플롯의 디폴트 색 팔레트가 나열되어 있습니다.
| 팔레트 | 팔레트 색 |
|---|---|
R2025a 이전: 대부분의 플롯이 기본적으로 이 색상을 사용합니다. |
|
|
|
orderedcolors 및 rgb2hex 함수를 사용하여 이 팔레트의 RGB 3색 및 16진수 색 코드를 구할 수 있습니다. 예를 들어, "gem" 팔레트의 RGB 3색을 구한 다음 16진수 색 코드로 변환합니다.
RGB = orderedcolors("gem");
H = rgb2hex(RGB);
R2024a 이전: H = compose("#%02X%02X%02X",round(RGB*255))를 사용하여 16진수 색 코드를 구합니다.
R2023b 이전: RGB = get(groot,"FactoryAxesColorOrder")를 사용하여 RGB 3색을 구합니다.
다음 표에는 라이트 테마와 다크 테마에서 플롯의 디폴트 색 팔레트가 나열되어 있습니다.
| 팔레트 | 팔레트 색 |
|---|---|
R2025a 이전: 대부분의 플롯이 기본적으로 이 색상을 사용합니다. |
|
|
|
orderedcolors 및 rgb2hex 함수를 사용하여 이 팔레트의 RGB 3색 및 16진수 색 코드를 구할 수 있습니다. 예를 들어, "gem" 팔레트의 RGB 3색을 구한 다음 16진수 색 코드로 변환합니다.
RGB = orderedcolors("gem");
H = rgb2hex(RGB);
R2024a 이전: H = compose("#%02X%02X%02X",round(RGB*255))를 사용하여 16진수 색 코드를 구합니다.
R2023b 이전: RGB = get(groot,"FactoryAxesColorOrder")를 사용하여 RGB 3색을 구합니다.
출력 인수
알고리즘
fsurf는 f의 기호 변수를 x축에 할당한 다음 y축에 할당하고 symvar은 할당할 변수의 순서를 정합니다. 그러므로 변수와 축 이름이 대응되지 않을 수 있습니다. fsurf가 대응되는 축에 x 또는 y를 할당하도록 강제하려면 플로팅할 기호 함수를 만든 다음 이 기호 함수를 fsurf에 전달하십시오.
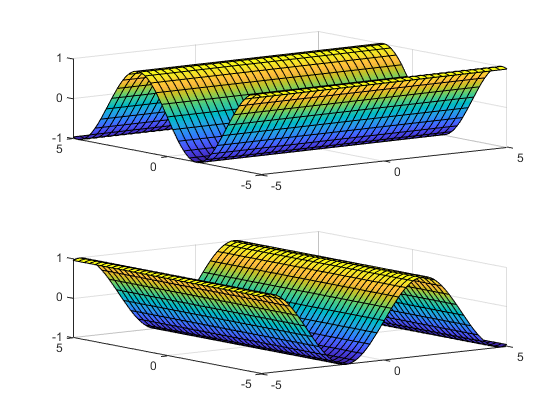
예를 들어, 다음 코드는 f(x,y) = sin(y)를 두 가지 방법으로 플로팅합니다. 첫 번째 방법에서는 파형이 y축에 대해 진동하도록 강제됩니다. 즉, 첫 번째 플롯은 y 변수를 그에 대응하는 y축에 할당합니다. 두 번째 플롯은 y를 x축에 할당합니다. 이것이 기호 함수에 있는 첫 번째(유일한) 변수이기 때문입니다.
syms x y;
f(x,y) = sin(y);

figure;
subplot(2,1,1)
fsurf(f);
subplot(2,1,2)
fsurf(f(x,y)); % Or fsurf(sin(y));
버전 내역
R2016a에 개발됨

