이 번역 페이지는 최신 내용을 담고 있지 않습니다. 최신 내용을 영문으로 보려면 여기를 클릭하십시오.
다양한 분류기의 결정 곡면을 시각화하기
이 예제에서는 다양한 분류 알고리즘의 결정 곡면을 플로팅하는 방법을 보여줍니다.
피셔(Fisher)의 붓꽃 데이터 세트를 불러옵니다.
load fisheriris
X = meas(:,1:2);
y = categorical(species);
labels = categories(y);X는 150개 붓꽃에 대한 2개의 꽃받침 측정값을 포함하는 숫자형 행렬입니다. Y는 이에 대응되는 붓꽃 종을 포함하는 문자형 벡터로 구성된 셀형 배열입니다.
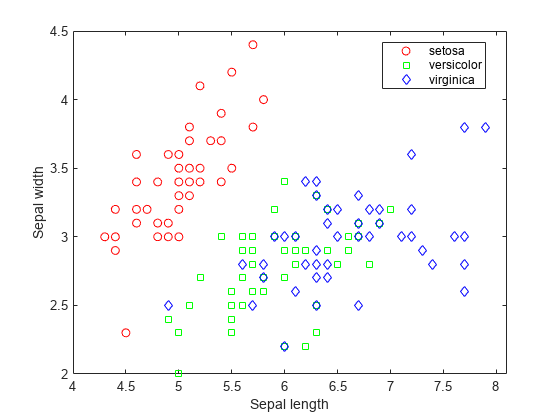
산점도 플롯을 사용하여 데이터를 시각화합니다. 붓꽃 종별로 변수를 그룹화합니다.
gscatter(X(:,1),X(:,2),species,'rgb','osd');
xlabel('Sepal length');
ylabel('Sepal width');
네 가지 다른 분류기를 훈련시키고 모델을 셀형 배열에 저장합니다.
classifier_name = {'Naive Bayes','Discriminant Analysis','Classification Tree','Nearest Neighbor'};나이브 베이즈 모델을 훈련시킵니다.
classifier{1} = fitcnb(X,y);판별분석 분류기를 훈련시킵니다.
classifier{2} = fitcdiscr(X,y);분류 결정 트리를 훈련시킵니다.
classifier{3} = fitctree(X,y);k-최근접이웃 분류기를 훈련시킵니다.
classifier{4} = fitcknn(X,y);실제 데이터 값의 일부 범위 내에서 전체 공간을 포괄하는 점의 그리드를 만듭니다.
x1range = min(X(:,1)):.01:max(X(:,1));
x2range = min(X(:,2)):.01:max(X(:,2));
[xx1, xx2] = meshgrid(x1range,x2range);
XGrid = [xx1(:) xx2(:)];
모든 분류기를 사용하여 XGrid에서 각 관측값의 붓꽃 종을 예측합니다. 결과에 대한 산점도 플롯을 플로팅합니다.
for i = 1:numel(classifier)
   predictedspecies = predict(classifier{i},XGrid);

   subplot(2,2,i);
   gscatter(xx1(:), xx2(:), predictedspecies,'rgb');

   title(classifier_name{i})
   legend off, axis tight
end

legend(labels,'Location',[0.35,0.01,0.35,0.05],'Orientation','Horizontal')
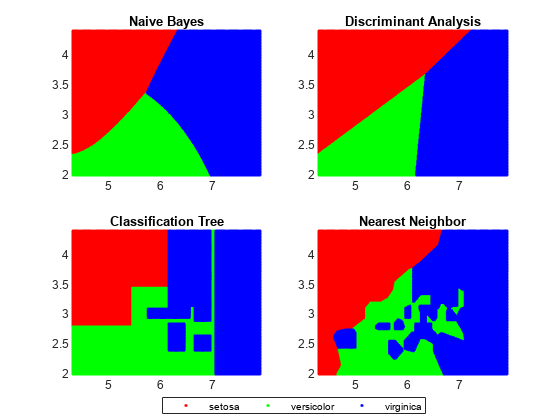
각 분류 알고리즘은 서로 다른 의사 결정 규칙을 생성합니다. 결정 곡면은 이러한 규칙을 시각화하는 데 도움이 될 수 있습니다.