Inspect and Modify Data and Messages While Debugging
While your Stateflow® chart is in debugging mode, you can examine the status of the chart by inspecting the values of data, messages, and temporal logic expressions. You can also test the design of the chart by modifying data values and sending local and output messages. This table summarizes the interfaces that you can use to perform these debugging tasks. For more information, see Set Breakpoints to Debug Charts.
| Debugging Task | Stateflow Editor | Symbols Pane | Breakpoints and Watch Window | MATLAB® Command Window |
|---|---|---|---|---|
| Inspect values of data and messages | Yes | Yes | Yes | Yes |
| Inspect values of buses and enumerations | Yes | No | Yes | Yes |
| Inspect temporal logic expressions | Yes | No | No | No |
| Modify values of data and messages | No | Yes | No | Yes |
| Send messages | No | No | No | Yes |
View Data in the Stateflow Editor
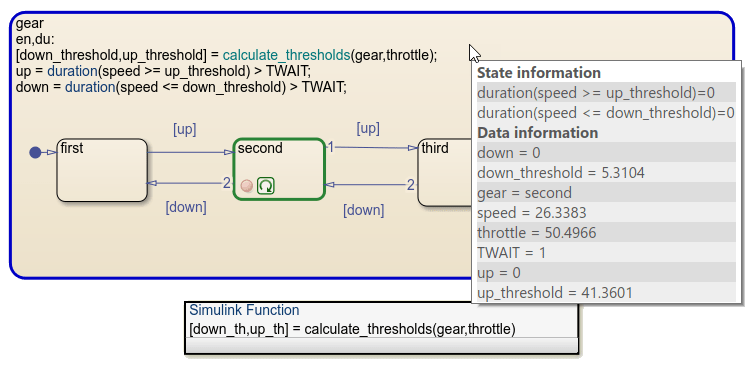
While the simulation is paused at a breakpoint, you can examine data values by pointing to a state, transition, or function in the chart. A tooltip displays the value of the data and the messages that the selected object uses.
| Object Type | Tooltip Information |
|---|---|
| States and transitions | Values of data, messages, and temporal logic expressions that the object uses |
| Graphical, truth table, and MATLAB functions | Values of local data, messages, inputs, and outputs in the scope of the function |
For example, the breakpoint in this chart pauses the simulation when the
second state evaluates its during actions. Pointing
to the superstate gear displays a tooltip that shows the values of:
Temporal logic expressions
duration(speed >= up_threshold)andduration(speed <= down_threshold).Data, including
speed,up_threshold, andup.

Note
If you select the chart properties Export chart level functions and Treat exported functions as globally visible, the tooltip does not display temporal logic data.
View and Modify Data in the Symbols Pane
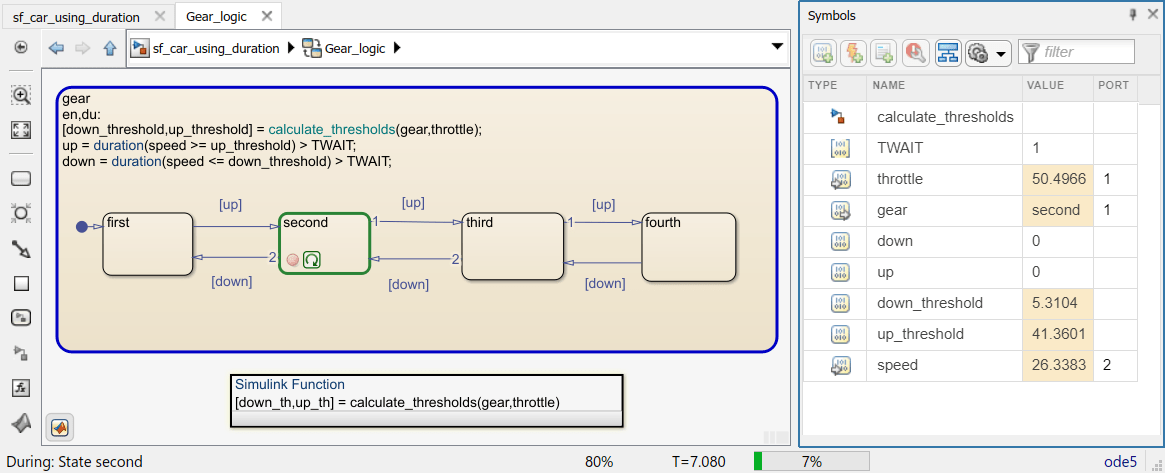
While a chart is in debugging mode, the Symbols pane displays the value of each data and message object in the chart. For example, when this chart pauses at the breakpoint, you can see the values of all chart data listed in the Value column. The highlighted values changed during the last time step.

In the Symbols pane, you can change the value of:
Data store memory, local, and output data.
Local and output messages.
Click the Value field for a data or message object to enter a new value.
You cannot change the values of constants, parameters, or input data and messages during simulation.
View Data in the Breakpoints and Watch Window
In the Stateflow Breakpoints and Watch window, you can view current data and message values
while the simulation is paused at a breakpoint. To open the Breakpoints and Watch window, on
the Debug tab, click Breakpoints List. Then, in
the Breakpoints List pane, click the Open the Stateflow breakpoint and watch list button ![]() .
.
To see a list of all of the breakpoints and their associated conditions, select the Breakpoints tab. For more information, see Manage Breakpoints Through the Breakpoints List Pane.
To inspect data and message values, select the Watch tab.
Track Data in the Watch List
You can use the Breakpoints and Watch window to:
Add data and message objects to a watch list.
Track the values that changed since the last time step.
Expand a message to view the message queue and message data values.
For example, you can add speed,
up_threshold, and up to the watch list and track
their values as you step through the simulation. The highlighting indicates that the
values of speed and up_threshold changed during the
last time step.

To add a data or message object to the watch list, open the Property Inspector or the Model Explorer. Select the data or message object you want to watch and click the Add to Watch Window link.
Alternatively, in the Stateflow Editor, right-click a state or transition that uses the data or message. Select Add to Watch Window and choose the variable name from the drop-down list.
Format Watch Display
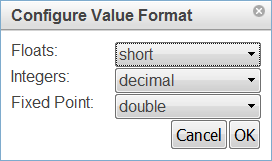
To change the format used to display watch data, select the gear icon
![]() at the top of the window. Use the drop-down lists to
choose a MATLAB format for each data type.
at the top of the window. Use the drop-down lists to
choose a MATLAB format for each data type.

Remove Data from the Watch List
To remove a data or message object from the watch list, point to the path for the watch data and click the Remove this watch icon that appears to the left of the variable name.

Save and Restore Watch Data
Watch data persists during a MATLAB session. When you close a model, its watch data list remains in the Breakpoints and Watch Window. If you reopen a model during the same MATLAB session, the watch data list for that model is restored.
You can save the breakpoint and watch data lists and reload them in a later MATLAB session. To save a snapshot of the breakpoint and watch data lists, at the top of the Breakpoints and Watch Window, click the Save current breakpoints and watches icon. To restore a snapshot, click the Load breakpoints and watches icon.
View and Modify Data in the MATLAB Command Window
While the simulation is paused at a breakpoint, the MATLAB command prompt changes to debug>>. At this prompt, you can
inspect and change the values of Stateflow data, send local and output messages, and interact with the MATLAB workspace.
For example, suppose that the previous chart has reached a breakpoint. To view the data
that is visible at the current scope, use the whos command.
whos
  Name                Size            Bytes  Class       Attributes

  TWAIT               1x1                 1  uint8
  down                1x1                 1  logical
  down_th             1x1                 8  double
  down_threshold      1x1                 8  double
  gear                1x1                 4  gearType
  speed               1x1                 8  double
  throttle            1x1                 8  double
  up                  1x1                 1  logical
  up_th               1x1                 8  double
  up_threshold        1x1                 8  double
To inspect the values of speed and up_threshold,
enter:
speed
speed =

   26.3383
up_threshold
up_threshold =

   41.3601
Modify Data by Using the Debugging Prompt
At the debugging prompt, you can change the value of data store memory, local, and
output data. For example, in the previous chart, you can change the value of
up_threshold, up, and
gear:
up_threshold = 25;
up = true;
gear = gearType.third;
To modify vectors and matrices, use MATLAB syntax for indexing, regardless of the action language property of your chart. See Indexing Notation.
For example, to change the element in the diagonal of a 2-by-2 matrix
u, enter:u(1,1) = 6.022e23; u(2,2) = 6.626e-34
You can change the dimensions of variable-size data as long as the new size is within the dimension bounds specified for the data. For example, suppose that
vis a variable-size array with a maximum size of[16 16]. To change the value ofvto a 5-by-7 array of ones, enter:v = ones(5,7);
To modify enumerated data, explicitly specify the enumerated type by using prefixed identifiers. See Notation for Enumerated Values.
For example, suppose that
whas an enumerated data typeColors. To change the value ofwto the enumerated valueRed, enter:w = Colors.Red
To modify numerical data, cast to an explicit data type by using a MATLAB type conversion function. Explicit casting is not required for data of a type
double. See Type Cast Operations.For example, suppose that
xhas typesingle,yhas typeint32, andzhas typefixdt(1,16,12). To change the value of these data objects, enter:x = single(98.6); y = int32(100); z = fi(0.5413,1,16,12);
You cannot change the values of constants, parameters, or input data at the debugging prompt.
Send Messages by Using the Debugging Prompt
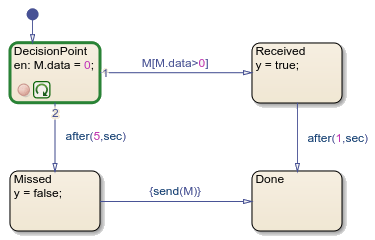
At the debugging prompt, you can send local and output messages. For example, in this
chart, the local message M determines which state becomes active after
the state DecisionPoint. If the chart receives the message
M with a positive value, the state Received
becomes active and the chart outputs a value of true. Otherwise, the
state Missed becomes active and the chart outputs a value of
false.

The initial value of the message is zero. To change the value of the data field to a positive number and send the message to its local queue, enter:
M = 5;
send(M);
Received. For more information,
see Control Chart Execution After a Breakpoint.Follow these rules when sending messages from the debugging prompt:
To read or write to the message data field of a valid message, use the name of the message object. Do not use dot notation syntax.
You can send a message from the debugging prompt only when the chart explicitly sends the message by calling the
sendoperator.You cannot send input messages from the debugging prompt.
For more information, see Control Message Activity in Stateflow Charts.
Access the MATLAB Workspace While Debugging
You can enter other MATLAB commands at the debugging prompt, but the results are executed in the
Stateflow workspace. For example, you can save all of the chart variables in a MAT
file by using the save
function:
save(chartVars)
To enter a command in the MATLAB base workspace, use the evalin command with the first argument "base". For
example, to list the variables in the MATLAB workspace, use the
command:
evalin("base","whos")