이 번역 페이지는 최신 내용을 담고 있지 않습니다. 최신 내용을 영문으로 보려면 여기를 클릭하십시오.
convertToChart
설명
예제
이 예제에서는 상태 천이 테이블을 Stateflow® 차트로 변환하는 방법을 보여줍니다.
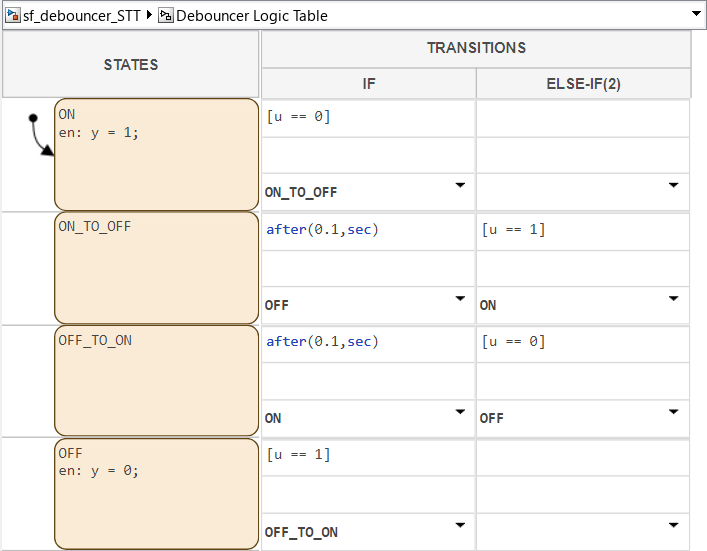
예제 모델을 열고 Stateflow.StateTransitionTableChart 객체에 액세스합니다.
open_system("sf_debouncer_STT")
table = find(sfroot,"-isa","Stateflow.StateTransitionTableChart");
view(table)
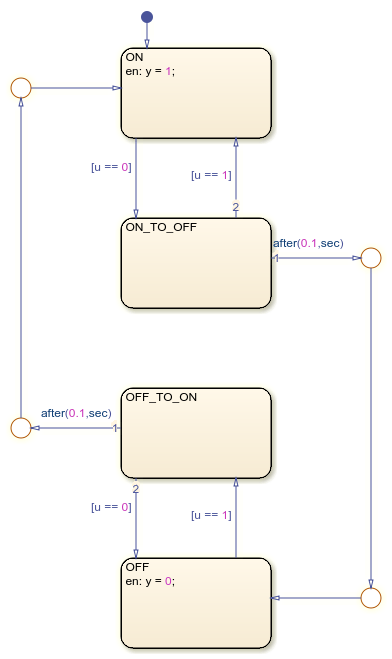
상태 천이 테이블을 Stateflow 차트로 변환합니다.
chart = convertToChart(table);
view(chart)
입력 인수
버전 내역
R2023b에 개발됨