Simulink 편집기에서 시뮬레이션 디버그하기
모델 캔버스에서 시뮬레이션 디버그 및 분석, 중단점 설정, 시간 스텝 단위의 순차적 실행 및 블록 단위의 순차적 실행
Simulink® 편집기에서 사용 가능한 디버그 툴을 사용하여 다음을 수행할 수 있습니다.
중단점을 설정하여 원하는 시점에서 시뮬레이션을 일시 중지합니다.
모델 전체에 걸쳐 중단점을 보고 관리합니다.
한 번에 하나의 시간 스텝 또는 한 번에 하나의 블록씩 시뮬레이션을 순차적으로 실행합니다.
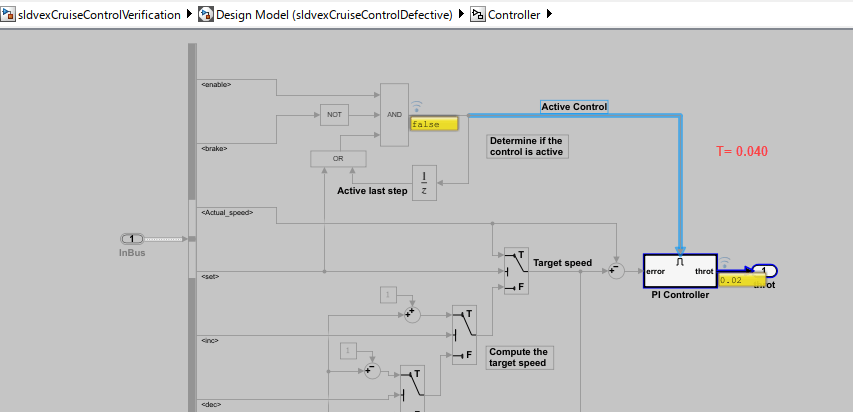
신호에 포트 값 레이블을 추가하여 시뮬레이션을 순차적으로 실행하면서 신호 값이 어떻게 바뀌는지 확인합니다.
모델 캔버스는 블록 다이어그램 내 컨텍스트에 중단점과 포트 값 레이블을 표시하므로 한 곳에서 모델을 분석, 디버그 및 수정할 수 있습니다.
툴
| 중단점 목록 | View, configure, and manage breakpoints for debugging models (R2022a 이후) |
| 시뮬레이션 스텝 옵션 | Enable stepping back and configure number of time steps to move when stepping through simulation |
| 시뮬레이션 속도 조절 옵션 | Slow simulation to a specified ratio of simulation time to wall clock time |
도움말 항목
시뮬레이션 일시 중지 및 스텝 이동
- Simulink 편집기를 사용하여 시뮬레이션을 순차적으로 실행하기
한 번에 하나 이상의 시간 스텝 또는 한 번에 한 블록씩 시뮬레이션을 실행하고, 블록 다이어그램에서 신호 값을 확인하고, 시뮬레이션 스텝 옵션을 구성합니다. - Debug Simulation Using Signal Breakpoints
Set breakpoints to pause simulation at points of interest for debugging and analysis. - How Stepping Through Simulations Works
Learn how the software steps through time steps and how to evaluate trade offs involved in configuring the simulation stepping options. - Debug Simulation of Iterator Subsystem
Explore options for stepping through and debugging simulations of models that contain iterator subsystems.
블록 다이어그램에서 정보 보기
- View Signal Values Using Port Value Labels
View signal values in the block diagram during simulation to understand, analyze, and debug your model. - Control and Display Execution Order
Determine the execution order among blocks within tasks. - View Sample Time Information
How to access sample time information interactively. - Use Connectors Tool to Visualize Relation Between Blocks
Use Connectors tool to visualize relation between Simulink functions and their function caller blocks, reader and writer blocks or blocks which execute based on events.
관련 정보
추천 예제
새로 만들기
Trace Faulty Signal Paths Using Model Slicer at Signal Breakpoints
Use Model Slicer from the Breakpoints List to trace faulty signal paths.