plot
Description
p = plot(___) returns the line object. Use
p to modify properties of the line after it is
created.
Examples
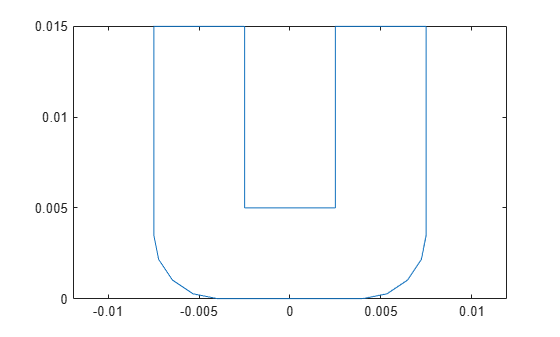
Create a curved U-bend shape.
ubend = ubendCurved;
Plot the shape.
plot(ubend)
Create a tee trace shape.
trace = traceTee;
Plot the shape using a red line of width 4 pixels.
plot(trace,LineWidth=4,Color="r")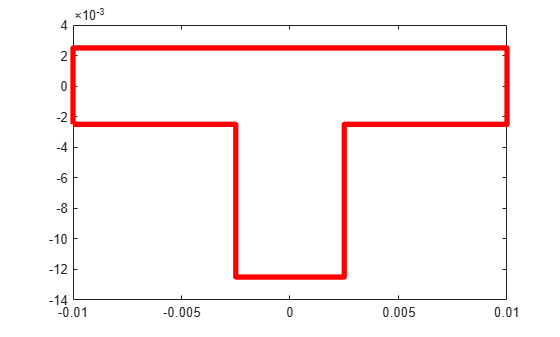
Input Arguments
Version History
Introduced in R2021b