clusterDBSCAN.estimateEpsilon
Estimate neighborhood clustering threshold
Syntax
Description
epsilon = clusterDBSCAN.estimateEpsilon(X,MinNumPoints,MaxNumPoints)epsilon,
used in the density-based spatial clustering of applications with noise (DBSCAN) algorithm.
epsilon is computed from input data X using a
k-nearest neighbor (k-NN) search.
MinNumPoints and MaxNumPoints set a range of
k-values for which epsilon is calculated. The range extends from
MinNumPoints – 1 through MaxNumPoints – 1.
k is the number of neighbors of a point, which is one less than the
number of points in a neighborhood.
clusterDBSCAN.estimateEpsilon(
displays a figure showing the k-NN search curves and the estimated
X,MinNumPoints,MaxNumPoints)epsilon. The neighborhood clustering threshold,
epsilon, is used in the density-based spatial clustering of
applications with noise (DBSCAN) algorithm. epsilon is computed from
input data X using a k-nearest neighbor
(k-NN) search. MinNumPoints and
MaxNumPoints set a range of k-values for which
epsilon is calculated. The range extends from MinNumPoints – 1 through
MaxNumPoints – 1. k is the number of neighbors
of a point, which is one less than the number of points in a neighborhood.
Examples
Create simulated target data and use the clusterDBSCAN.estimateEpsilon function to calculate an appropriate epsilon threshold.
Create the target data as xy Cartesian coordinates.
X = [randn(20,2) + [11.5,11.5]; randn(20,2) + [25,15]; ...
    randn(20,2) + [8,20]; 10*rand(10,2) + [20,20]];
Set the range of values for the k-NN search.
minNumPoints = 15;
maxNumPoints = 20;
Estimate the clustering threshold epsilon and display its value on a plot.
clusterDBSCAN.estimateEpsilon(X,minNumPoints,maxNumPoints)
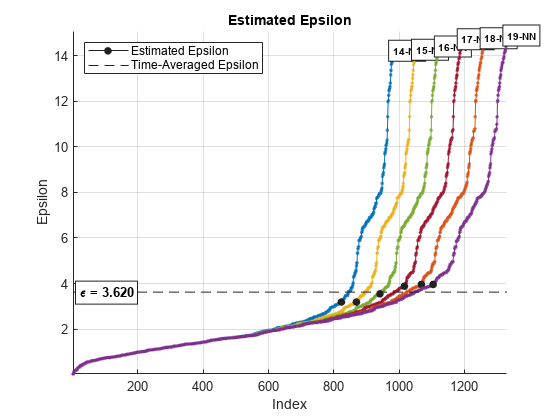
Use the estimated Epsilon value, 3.62, in the clusterDBSCAN clusterer. Then, plot the clusters.
clusterer = clusterDBSCAN('MinNumPoints',6,'Epsilon',3.62, ...
    'EnableDisambiguation',false);
[idx,cidx] = clusterer(X);
plot(clusterer,X,idx)

Input Arguments
Output Arguments
Algorithms
DBSCAN clustering requires a value for the neighborhood size parameter ε. The
clusterDBSCAN object and the
clusterDBSCAN.estimateEpsilon function use a
k-nearest-neighbor search to estimate a scalar epsilon. Let
D be the distance of any point P to its
kth nearest neighbor. Define a
Dk(P)-neighborhood as a
neighborhood surrounding P that contains its
k-nearest neighbors. There are k + 1 points in the
Dk(P)-neighborhood
including the point P itself. An outline of the estimation algorithm
is:
For each point, find all the points in its Dk(P)-neighborhood
Accumulate the distances in all Dk(P)-neighborhoods for all points into a single vector.
Sort the vector by increasing distance.
Plot the sorted k-dist graph, which is the sorted distance against point number.
Find the knee of the curve. The value of the distance at that point is an estimate of epsilon.
The figure here shows distance plotted against point index for k = 20. The knee occurs at approximately 1.5. Any points below this threshold belong to a cluster. Any points above this value are noise.

There are several methods to find the knee of the curve. clusterDBSCAN and
clusterDBSCAN.estimateEpsilon first define the line connecting the
first and last points of the curve. The ordinate of the point on the sorted
k-dist graph furthest from the line and perpendicular to the line
defines epsilon.

When you specify a range of k values, the algorithm averages the estimate epsilon values for all curves. This figure shows that epsilon is fairly insensitive to k for k ranging from 14 through 19.

To create a single k-NN distance graph, set the
MinNumPoints property equal to the
MaxNumPoints property.
Extended Capabilities
Version History
Introduced in R2021a