Main Content

interpolateVonMisesStress

Interpolate von Mises stress at arbitrary spatial locations

Description

example

intrpVMStress = interpolateVonMisesStress(structuralresults,xq,yq) returns the interpolated von Mises stress values at the 2-D points specified in xq and yq. For transient and frequency-response structural models, interpolateVonMisesStress interpolates von Mises stress for all time- or frequency-steps, respectively.

example

intrpVMStress = interpolateVonMisesStress(structuralresults,xq,yq,zq) uses the 3-D points specified in xq, yq, and zq.

example

intrpVMStress = interpolateVonMisesStress(structuralresults,querypoints) uses the points specified in querypoints.

Examples

collapse all

Create a structural analysis model for a plane-strain problem.

structuralmodel = createpde("structural","static-planestrain");

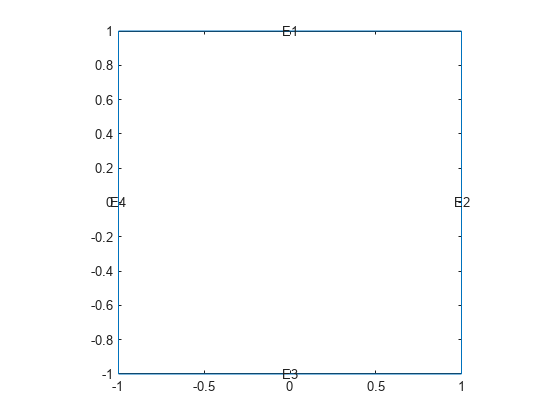
Include the square geometry in the model. Plot the geometry.

geometryFromEdges(structuralmodel,@squareg);
pdegplot(structuralmodel,"EdgeLabels","on")
axis equal

Specify Young's modulus and Poisson's ratio.

structuralProperties(structuralmodel,"PoissonsRatio",0.3, ...
                                     "YoungsModulus",210E3);

Specify the x-component of the enforced displacement for edge 1.

structuralBC(structuralmodel,"XDisplacement",0.001,"Edge",1);

Specify that edge 3 is a fixed boundary.

structuralBC(structuralmodel,"Constraint","fixed","Edge",3);

Generate a mesh and solve the problem.

generateMesh(structuralmodel);
structuralresults = solve(structuralmodel);

Create a grid and interpolate the von Mises stress to the grid.

v = linspace(-1,1,151);
[X,Y] = meshgrid(v);
intrpVMStress = interpolateVonMisesStress(structuralresults,X,Y);

Reshape the von Mises stress to the shape of the grid and plot it.

VMStress = reshape(intrpVMStress,size(X));
p = pcolor(X,Y,VMStress);
p.EdgeColor="none";
colorbar

Solve a static structural model representing a bimetallic cable under tension, and interpolate the von Mises stress on a cross-section of the cable.

Create a static structural model for solving a solid (3-D) problem.

structuralmodel = createpde("structural","static-solid");

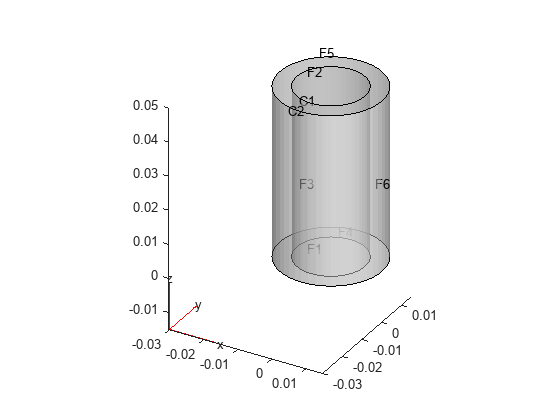
Create the geometry and include it in the model. Plot the geometry.

gm = multicylinder([0.01,0.015],0.05);
structuralmodel.Geometry = gm;
pdegplot(structuralmodel,"FaceLabels","on", ...
                         "CellLabels","on", ...
                         "FaceAlpha",0.5)

Specify Young's modulus and Poisson's ratio for each metal.

structuralProperties(structuralmodel,"Cell",1,"YoungsModulus",110E9, ...
                                              "PoissonsRatio",0.28);
structuralProperties(structuralmodel,"Cell",2,"YoungsModulus",210E9, ...
                                              "PoissonsRatio",0.3);

Specify that faces 1 and 4 are fixed boundaries.

structuralBC(structuralmodel,"Face",[1,4],"Constraint","fixed");

Specify the surface traction for faces 2 and 5.

structuralBoundaryLoad(structuralmodel,"Face",[2,5], ...
                                       "SurfaceTraction",[0;0;100]);

Generate a mesh and solve the problem.

generateMesh(structuralmodel);
structuralresults = solve(structuralmodel)
structuralresults = 
  StaticStructuralResults with properties:

      Displacement: [1x1 FEStruct]
            Strain: [1x1 FEStruct]
            Stress: [1x1 FEStruct]
    VonMisesStress: [22767x1 double]
              Mesh: [1x1 FEMesh]

Define the coordinates of a midspan cross-section of the cable.

[X,Y] = meshgrid(linspace(-0.015,0.015,50));
Z = ones(size(X))*0.025;

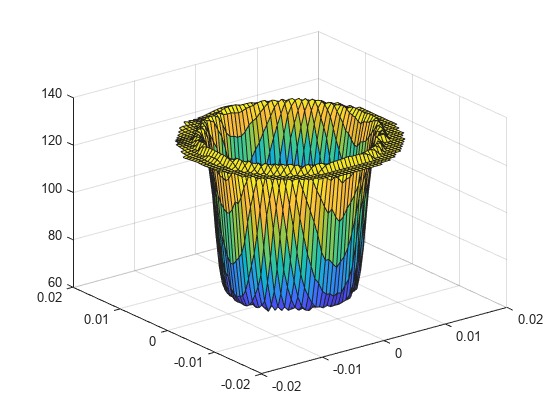
Interpolate the von Mises stress and plot the result.

IntrpVMStress = interpolateVonMisesStress(structuralresults,X,Y,Z);
surf(X,Y,reshape(IntrpVMStress,size(X)))

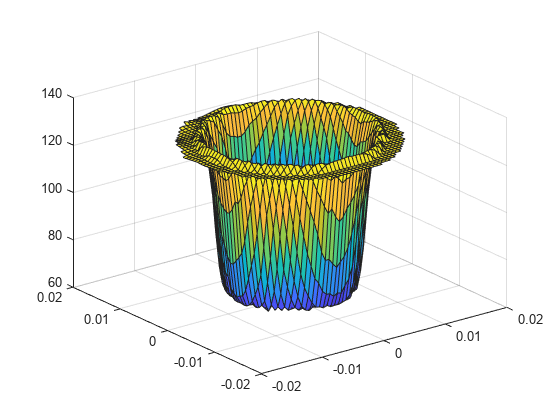
Alternatively, you can specify the grid by using a matrix of query points.

querypoints = [X(:),Y(:),Z(:)]';
IntrpVMStress = ...
    interpolateVonMisesStress(structuralresults,querypoints);
surf(X,Y,reshape(IntrpVMStress,size(X)))

Interpolate the von Mises stress at the geometric center of a beam under a harmonic excitation.

Create a transient dynamic model for a 3-D problem.

structuralmodel = createpde("structural","transient-solid");

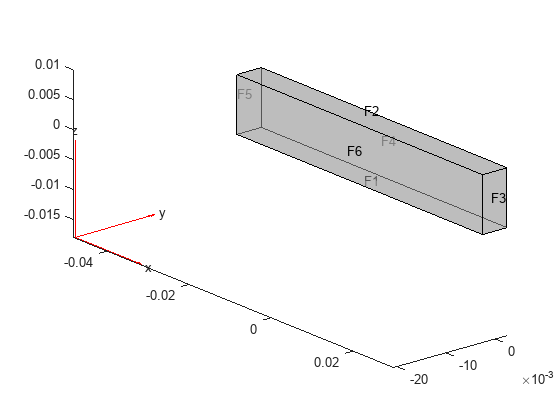
Create the geometry and include it in the model. Plot the geometry.

gm = multicuboid(0.06,0.005,0.01);
structuralmodel.Geometry = gm;
pdegplot(structuralmodel,"FaceLabels","on","FaceAlpha",0.5)
view(50,20)

Specify Young's modulus, Poisson's ratio, and the mass density of the material.

structuralProperties(structuralmodel,"YoungsModulus",210E9, ...
                                     "PoissonsRatio",0.3, ...
                                     "MassDensity",7800);

Fix one end of the beam.

structuralBC(structuralmodel,"Face",5,"Constraint","fixed");

Apply a sinusoidal displacement along the y-direction on the end opposite the fixed end of the beam.

structuralBC(structuralmodel,"Face",3, ...
                             "YDisplacement",1E-4, ...
                             "Frequency",50);

Generate a mesh.

generateMesh(structuralmodel,"Hmax",0.01);

Specify the zero initial displacement and velocity.

structuralIC(structuralmodel,"Displacement",[0;0;0], ...
                             "Velocity",[0;0;0]);

Solve the model.

tlist = 0:0.002:0.2;
structuralresults = solve(structuralmodel,tlist);

Interpolate the von Mises stress at the geometric center of the beam.

coordsMidSpan = [0;0;0.005];
VMStress = interpolateVonMisesStress(structuralresults,coordsMidSpan);

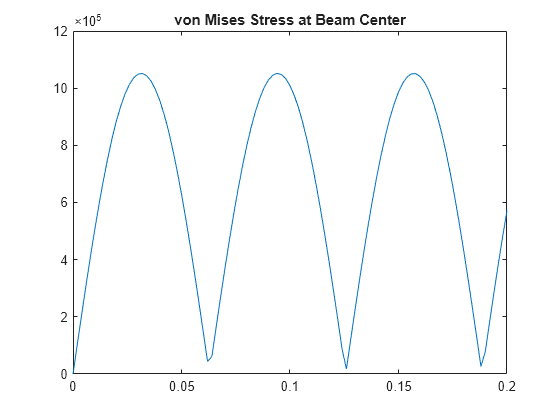
Plot the von Mises stress at the geometric center of the beam.

figure
plot(structuralresults.SolutionTimes,VMStress)
title("von Mises Stress at Beam Center")

Input Arguments

collapse all

Solution of the structural analysis problem, specified as a StaticStructuralResults, TransientStructuralResults, or FrequencyStructuralResults object. Create structuralresults by using the solve function.

Example: structuralresults = solve(structuralmodel)

x-coordinate query points, specified as a real array. interpolateVonMisesStress evaluates the von Mises stress at the 2-D coordinate points [xq(i),yq(i)] or at the 3-D coordinate points [xq(i),yq(i),zq(i)]. Therefore, xq, yq, and (if present) zq must have the same number of entries.

interpolateVonMisesStress converts query points to column vectors xq(:), yq(:), and (if present) zq(:). The function returns von Mises stress as a column vector of the same size as the query point column vectors. To ensure that the dimensions of the returned solution are consistent with the dimensions of the original query points, use the reshape function. For example, use intrpVMStress = reshape(intrpVMStress,size(xq)).

Data Types: double

y-coordinate query points, specified as a real array. interpolateVonMisesStress evaluates the von Mises stress at the 2-D coordinate points [xq(i),yq(i)] or at the 3-D coordinate points [xq(i),yq(i),zq(i)]. Therefore, xq, yq, and (if present) zq must have the same number of entries. Internally, interpolateVonMisesStress converts the query points to the column vector yq(:).

Data Types: double

z-coordinate query points, specified as a real array. interpolateVonMisesStress evaluates the von Mises stress at the 3-D coordinate points [xq(i),yq(i),zq(i)]. Therefore, xq, yq, and zq must have the same number of entries. Internally, interpolateVonMisesStress converts the query points to the column vector zq(:).

Data Types: double

Query points, specified as a real matrix with either two rows for 2-D geometry or three rows for 3-D geometry. interpolateVonMisesStress evaluates the von Mises stress at the coordinate points querypoints(:,i), so each column of querypoints contains exactly one 2-D or 3-D query point.

Example: For 2-D geometry, querypoints = [0.5,0.5,0.75,0.75; 1,2,0,0.5]

Data Types: double

Output Arguments

collapse all

von Mises stress at the query points, returned as a column vector.

For query points that are outside the geometry, intrpVMStress = NaN.

Version History

Introduced in R2017b

expand all