timeseries2timetable
설명
TT = timeseries2timetable(는 ts)timeseries 객체를 타임테이블로 변환합니다.
ts가timeseries객체이면TT는 하나의 변수를 갖는 타임테이블입니다.ts가timeseries객체로 구성된 배열이면TT는ts에 포함된timeseries객체의 개수와 동일한 개수의 변수를 갖는 타임테이블입니다.ts의 모든timeseries객체는 동일한 샘플 시간을 가져야 합니다.timeseries객체에 이벤트가 있는 경우 함수는 이벤트를 이벤트 테이블로 변환하고 이벤트 테이블을TT에 연결합니다. 이벤트가 중복되면 이벤트 테이블에 중복 행이 생깁니다. (R2024b 이후)
예제
10초 간격으로 샘플링된 5개의 난수를 갖는 timeseries 객체를 만듭니다.
ts = timeseries(rand(5,1),[0 10 20 30 40])
  timeseries

  Common Properties:
            Name: 'unnamed'
            Time: [5x1 double]
        TimeInfo: [1x1 tsdata.timemetadata]
            Data: [5x1 double]
        DataInfo: [1x1 tsdata.datametadata]

  More properties, Methods
ts의 시간 및 데이터를 표시합니다.
ts.Time
ans = 5×1

     0
    10
    20
    30
    40
ts.Data
ans = 5×1

    0.8147
    0.9058
    0.1270
    0.9134
    0.6324
ts를 타임테이블로 변환합니다.
TT = timeseries2timetable(ts)
TT=5×1 timetable
     Time      Data
    ______    _______

    0 sec     0.81472
    10 sec    0.90579
    20 sec    0.12699
    30 sec    0.91338
    40 sec    0.63236
timeseries 객체로 구성된 배열을 만듭니다. 동일한 샘플 시간을 갖는 동일한 벡터를 사용하되, 각 시계열에 서로 다른 이름을 지정합니다. rand 함수를 사용하여 서로 다른 데이터 값을 갖는 배열을 만듭니다.
ts1 = timeseries(rand(5,1),[0 10 20 30 40],"Name","Series_1");
ts2 = timeseries(rand(5,1),[0 10 20 30 40],"Name","Series_2");
ts3 = timeseries(rand(5,1),[0 10 20 30 40],"Name","Series_3");
ts = [ts1 ts2 ts3]
  1×3 timeseries array with properties:

    Events
    Name
    UserData
    Data
    DataInfo
    Time
    TimeInfo
    Quality
    QualityInfo
    IsTimeFirst
    TreatNaNasMissing
    Length
모든 timeseries 객체의 데이터를 하나의 타임테이블로 결합합니다. 배열의 각 시계열은 타임테이블의 변수 하나를 생성합니다.
TT = timeseries2timetable(ts)
TT=5×3 timetable
     Time     Series_1    Series_2    Series_3
    ______    ________    ________    ________

    0 sec     0.81472     0.09754     0.15761
    10 sec    0.90579      0.2785     0.97059
    20 sec    0.12699     0.54688     0.95717
    30 sec    0.91338     0.95751     0.48538
    40 sec    0.63236     0.96489     0.80028
여러 timeseries 객체를 타임테이블로 변환합니다.
ts1 = timeseries(rand(5,1),[0 10 20 30 40],"Name","Series_1");
ts2 = timeseries(rand(5,1),[0 10 20 30 40],"Name","Series_2");
ts3 = timeseries(rand(5,1),[0 10 20 30 40],"Name","Series_3");
TT = timeseries2timetable(ts1,ts2,ts3)
TT=5×3 timetable
     Time     Series_1    Series_2    Series_3
    ______    ________    ________    ________

    0 sec     0.81472     0.09754     0.15761
    10 sec    0.90579      0.2785     0.97059
    20 sec    0.12699     0.54688     0.95717
    30 sec    0.91338     0.95751     0.48538
    40 sec    0.63236     0.96489     0.80028
3개의 도시 교차로에 대한 차량 교통량 데이터가 포함된 timeseries 객체 3개를 불러옵니다.
load trafficCounts.mat count1 count2 count3
첫 번째 timeseries 객체의 속성을 표시합니다. 이러한 속성에는 교통량 데이터, 데이터가 수집된 시간, 그리고 2개의 이벤트가 저장되어 있습니다. 이벤트는 tsdata.event 객체입니다.
count1
  timeseries

  Common Properties:
            Name: 'Intersection1'
            Time: [15x1 double]
        TimeInfo: [1x1 tsdata.timemetadata]
            Data: [15x1 double]
        DataInfo: [1x1 tsdata.datametadata]
          Events: [1x2 tsdata.event]

  More properties, Methods
count1에 연결된 첫 번째 이벤트를 표시합니다.
count1.Events(1)
    EventData: []
         Name: 'AMCommute'
         Time: 8
        Units: 'hours'
    StartDate: ''
두 번째 이벤트를 표시합니다. 이벤트는 아침과 저녁 통근 시간에 레이블을 지정합니다.
count1.Events(2)
    EventData: []
         Name: 'PMCommute'
         Time: 18
        Units: 'hours'
    StartDate: ''
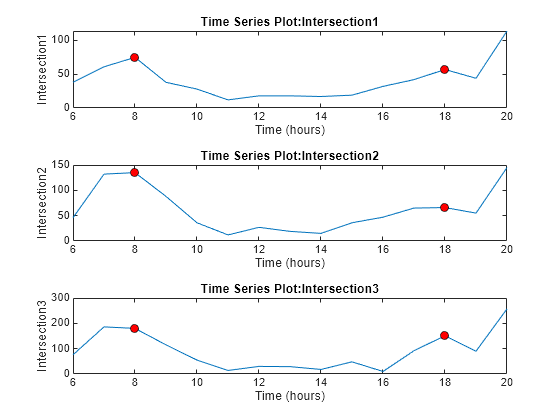
timeseries 객체 3개의 데이터를 플로팅합니다. 서브플롯에 시계열을 표시하기 위한 타일 형식 차트 레이아웃을 만들려면 tiledlayout 함수를 사용하십시오. 차트는 시계열 3개와 연결된 이벤트를 나타내는 빨간색 점을 표시합니다.
tiledlayout(3,1)
nexttile
plot(count1)
nexttile
plot(count2)
nexttile
plot(count3)

3개의 timeseries 객체를 1개의 타임테이블로 변환합니다. 행 시간값의 형식을 hh:mm 형식으로 설정합니다. 이벤트는 시계열 3개에서 같은 시간에 발생하므로 타임테이블에는 08:00과 18:00에 3개의 이벤트 레이블이 있습니다.
TT = timeseries2timetable(count1,count2,count3);
TT.Time.Format = "hh:mm"TT=15×3 timetable with 6 events
Time Intersection1 Intersection2 Intersection3
_____ _____________ _____________ _____________
06:00 38 46 76
07:00 61 132 186
<3 events> 08:00 75 135 180
09:00 38 88 115
10:00 28 36 55
11:00 12 12 14
12:00 18 27 30
13:00 18 19 29
14:00 17 15 18
15:00 19 36 48
16:00 32 47 10
17:00 42 65 92
<3 events> 18:00 57 66 151
19:00 44 55 90
20:00 114 145 257
이 변환은 이벤트 객체를 이벤트 테이블로도 변환합니다. 이벤트 테이블은 타임테이블에 연결되어 있습니다. 이벤트 테이블은 2개의 시간에 3개의 같은 이벤트가 있음을 보여줍니다.
TT.Properties.Events
ans = 6×1 eventtable
  Event Labels Variable: EventLabels
  Event Lengths Variable: <instantaneous>

    Time     EventLabels
    _____    ___________

    8 hr     "AMCommute"
    8 hr     "AMCommute"
    8 hr     "AMCommute"
    18 hr    "PMCommute"
    18 hr    "PMCommute"
    18 hr    "PMCommute"
반복되는 이벤트가 있는 이벤트 테이블을 정리할 수 있습니다. 한 가지 방법은 unique 함수를 사용하는 것입니다.
ET = TT.Properties.Events;
ET = unique(ET)
ET = 2×1 eventtable
  Event Labels Variable: EventLabels
  Event Lengths Variable: <instantaneous>

    Time     EventLabels
    _____    ___________

    8 hr     "AMCommute"
    18 hr    "PMCommute"
정리된 이벤트 테이블을 타임테이블에 연결합니다. 타임테이블을 표시합니다.
TT.Properties.Events = ET
TT=15×3 timetable with 2 events
                 Time     Intersection1    Intersection2    Intersection3
                 _____    _____________    _____________    _____________

                 06:00          38               46               76
                 07:00          61              132              186
    AMCommute    08:00          75              135              180
                 09:00          38               88              115
                 10:00          28               36               55
                 11:00          12               12               14
                 12:00          18               27               30
                 13:00          18               19               29
                 14:00          17               15               18
                 15:00          19               36               48
                 16:00          32               47               10
                 17:00          42               65               92
    PMCommute    18:00          57               66              151
                 19:00          44               55               90
                 20:00         114              145              257
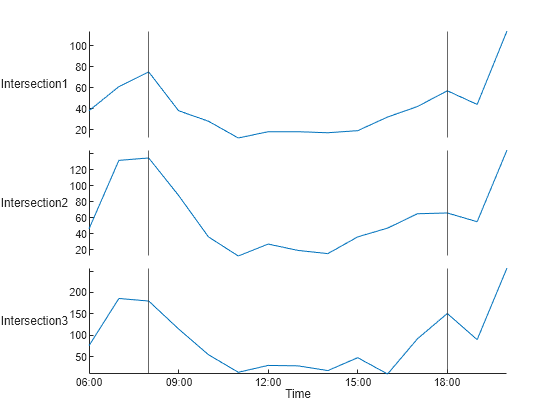
타임테이블의 교통량 데이터로 구성된 차트를 만듭니다. 먼저 새 Figure 창을 만들어 tiledlayout에서 만든 서브플롯을 재사용하지 않도록 합니다. 그런 다음 타임테이블의 데이터를 플로팅하려면 stackedplot을 사용하십시오. stackedplot 함수는 각 타임테이블 변수를 서브플롯에 플로팅하고 이벤트가 발생하는 시간에 검은색 세로선을 표시합니다.
figure
stackedplot(TT)

입력 인수
입력 시계열로, timeseries 객체로 구성된 배열로 지정됩니다.
이 함수는 ts의 몇몇 속성을 사용하여 타임테이블의 데이터를 할당하거나 속성을 설정합니다. 다음 표는 각 timeseries 속성에 대한 출력 타임테이블에서의 결과를 설명합니다.
입력 | 출력 타임테이블의 결과 |
|---|---|
| 대응되는 타임테이블 변수의 이름을 지정합니다.
|
| 대응되는 타임테이블 변수에 할당되는 데이터를 지정합니다. |
| 대응되는 타임테이블 변수의 |
| 대응되는 타임테이블 변수의 |
| 샘플 시간을 타임테이블의 행 시간값으로 변환합니다. 행 시간값으로 구성된 벡터는 입력값의 |
| 행 시간값의 단위를 지정합니다. 타임테이블 행 시간값으로 구성된 벡터가 |
| 행 시간값의 형식을 설정합니다. |
| 타임테이블의 |
| 타임테이블의 |
|
|
| 데이터의 방향을 변경해야 하는지 확인합니다. |
| 타임테이블의 |
| 이벤트를 이벤트 테이블의 항목으로 변환하고 이벤트 테이블을 타임테이블에 연결합니다. (R2024b 이후) 입력 시계열의 이벤트가 중복되면 이벤트 테이블에 중복 행이 생깁니다. |
| 경고합니다. |
|
|
버전 내역
R2021a에 개발됨이벤트가 있는 timeseries 객체를 이벤트 테이블이 있는 타임테이블로 변환할 수 있습니다. timeseries2timetable은 timeseries 객체를 타임테이블로 변환할 때, 연결된 모든 tsdata.event 객체도 이벤트 테이블로 변환합니다. 그런 다음 이 함수는 이벤트 테이블을 타임테이블에 연결합니다.
R2024b 이전 버전에서 timeseries2timetable은 timeseries 객체를 타임테이블로 변환할 때 이벤트를 무시했습니다.
ts2timetable 함수가 이제 timeseries2timetable로 이름이 변경되었습니다. 이 함수의 동작은 동일하게 유지되며, 코드에 있는 ts2timetable의 기존 인스턴스는 계속 예상대로 동작합니다. ts2timetable의 기존 참조에 대한 지원을 제거할 계획은 없습니다.
MATLAB Command
You clicked a link that corresponds to this MATLAB command:
Run the command by entering it in the MATLAB Command Window. Web browsers do not support MATLAB commands.
웹사이트 선택
번역된 콘텐츠를 보고 지역별 이벤트와 혜택을 살펴보려면 웹사이트를 선택하십시오. 현재 계신 지역에 따라 다음 웹사이트를 권장합니다:
또한 다음 목록에서 웹사이트를 선택하실 수도 있습니다.
사이트 성능 최적화 방법
최고의 사이트 성능을 위해 중국 사이트(중국어 또는 영어)를 선택하십시오. 현재 계신 지역에서는 다른 국가의 MathWorks 사이트 방문이 최적화되지 않았습니다.
미주
- América Latina (Español)
- Canada (English)
- United States (English)
유럽
- Belgium (English)
- Denmark (English)
- Deutschland (Deutsch)
- España (Español)
- Finland (English)
- France (Français)
- Ireland (English)
- Italia (Italiano)
- Luxembourg (English)
- Netherlands (English)
- Norway (English)
- Österreich (Deutsch)
- Portugal (English)
- Sweden (English)
- Switzerland
- United Kingdom (English)