지리 좌표축과 지리 차트의 바탕 지도에 액세스하기
MathWorks®는 지리 좌표축과 지리 차트에서 사용할 수 있는 여러 개의 바탕 지도를 제공합니다. 바탕 지도에는 2색조, 컬러 지형도 및 고배율 표시를 비롯한 다양한 지도 옵션이 있습니다. 바탕 지도 중 6개는 Natural Earth를 사용하여 생성된 타일 형식의 데이터 세트입니다. 바탕 지도 중 5개는 Esri®에서 호스트하는 고배율 지도입니다. 바탕 지도 옵션에 대한 자세한 내용은 geobasemap을 참조하십시오.
지리 좌표축 또는 지리 차트에 사용할 바탕 지도를 지정하려면 다음 중 하나를 수행하면 됩니다.
geobasemap함수를 사용합니다.GeographicAxes객체 또는GeographicBubbleChart객체의Basemap속성을 설정합니다.
Mapping Toolbox™ 함수 addToolbarMapButton (Mapping Toolbox)을 사용하여 좌표축 도구 모음에 바탕 지도 선택기를 추가할 수도 있습니다.
MATLAB®에는 하나의 바탕 지도('darkwater'라고 명명된 2색조 지도)가 설치되어 있습니다. 이 바탕 지도는 인터넷이 연결되지 않아도 사용할 수 있습니다. 디폴트 바탕 지도인 'streets-light'를 포함하여 다른 바탕 지도는 인터넷이 연결되어야 사용할 수 있습니다.
인터넷을 통해 바탕 지도에 액세스하는 데 문제가 있는 경우 프록시 서버 설정을 확인하십시오. 프록시 서버 설정을 지정하는 방법에 대한 자세한 내용은 프록시 서버 설정에 MATLAB 웹 설정 사용하기 항목을 참조하십시오.
인터넷 연결 상태가 불안정하거나 지도의 반응 속도를 개선하려면 'darkwater' 바탕 지도를 사용하여 플로팅하거나 바탕 지도를 로컬 시스템으로 다운로드하면 됩니다.
지리 플롯에 "darkwater" 표시하기
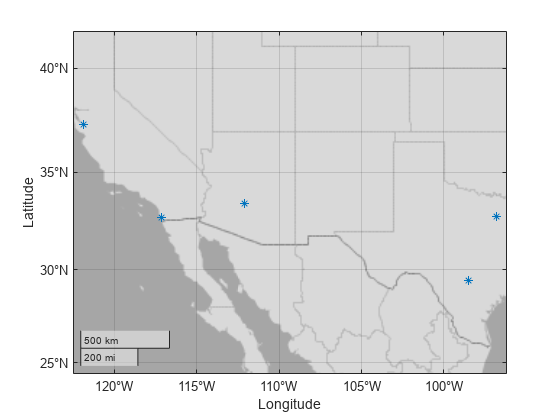
geoplot 및 geoscatter와 같은 함수를 사용하여 플로팅할 때 "darkwater" 바탕 지도를 표시하려면 geobasemap을 호출하십시오.
lat1 = [33.448 29.424 32.716 32.777 37.338];
lon1 = [-112.074 -98.494 -117.161 -96.797 -121.886];
geoscatter(lat1,lon1,"*")
geobasemap darkwater

또는 지리 좌표축 세트를 만들고 Basemap 이름-값 쌍을 지정할 수도 있습니다.
figure
lat2 = [40.713 34.052 41.878 29.760 39.952];
lon2 = [-74.006 -118.244 -87.630 -95.370 -75.165];
geoaxes("Basemap","darkwater")
geoscatter(lat2,lon2,"*")

MATLAB 세션 중에 geoplot, geoscatter 및 geodensityplot으로 생성된 모든 플롯에 대한 디폴트 바탕 지도를 변경할 수도 있습니다.
set(groot,"defaultGeoaxesBasemap","darkwater")
거품 지리 차트에 "darkwater" 표시하기
거품 지리 차트에 "darkwater"를 표시하려면 Basemap 이름-값 인수를 사용하여 geobubble을 호출하십시오.
tsunamis = readtable("tsunamis.xlsx");
geobubble(tsunamis,"Latitude","Longitude","Basemap","darkwater")

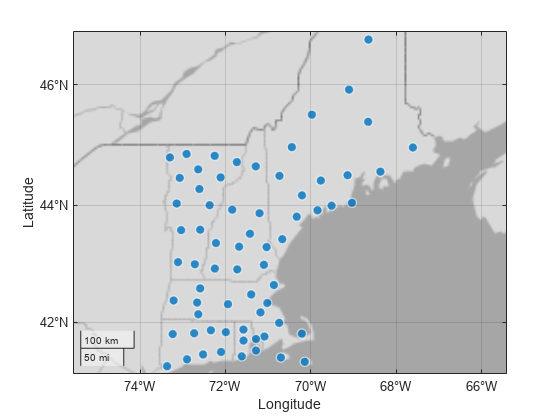
또는 geobasemap을 사용하여 바탕 지도를 지정할 수도 있습니다.
counties = readtable("counties.xlsx");
geobubble(counties,"Latitude","Longitude")
geobasemap darkwater

바탕 지도 다운로드하기
애드온 탐색기를 사용하여 바탕 지도를 로컬 시스템으로 다운로드할 수 있습니다. Esri에서 제공되는 고배율 바탕 지도 5개는 다운로드할 수 없습니다.
MATLAB 홈 탭의 환경 섹션에서 애드온 > 애드온 받기를 클릭합니다.
애드온 탐색기에서 MathWorks 부가기능 섹션으로 스크롤하고 모두 표시를 클릭하여 바탕 지도 패키지를 찾습니다. 또한, (다음 표에 나열된) 이름으로 바탕 지도 애드온을 검색하거나 유형별 필터링에서 부가기능을 클릭할 수 있습니다.
다운로드할 바탕 지도 데이터 패키지를 선택합니다.
바탕 지도 이름 바탕 지도 데이터 패키지 이름 'bluegreen'MATLAB Basemap Data - bluegreen 'grayland'MATLAB Basemap Data - grayland 'colorterrain'MATLAB Basemap Data - colorterrain 'grayterrain'MATLAB Basemap Data - grayterrain 'landcover'MATLAB Basemap Data - landcover
바탕 지도 캐싱 동작
인터넷을 통해 바탕 지도에 액세스하면 MATLAB은 바탕 지도 타일을 일시적으로 캐싱하여 성능을 개선합니다. 이 캐싱 동작으로 인해 프로그램은 사용자가 지도 내에서 패닝 및 확대/축소를 수행할 때 각 타일을 한 번만 다운로드하면 됩니다. 또한 지도 타일이 저장되므로 인터넷 연결이 끊기더라도 지도에서 이미 본 부분은 계속 볼 수 있습니다.
인터넷에 연결되어 있지 않은 상태로 지도에서 이전에 본 적이 없는 부분을 보려 할 수 있겠으나, 그 영역에 대한 타일은 캐시에 존재하지 않습니다. Natural Earth를 사용하여 생성된 바탕 지도의 경우, 누락된 타일은 'darkwater' 바탕 지도의 타일로 대체됩니다.
Esri에서 제공되는 고배율 바탕 지도의 경우, 제한된 개수의 타일이 캐싱되며 이렇게 캐싱된 타일은 제한 시간이 지난 후 만료됩니다. 캐싱되지 않은 고배율 바탕 지도 영역을 보려고 하면 빈 지도 타일이 표시됩니다. 지리 차트는 이 누락된 타일에 대해 'darkwater'의 타일을 사용하지 않습니다.
참고 항목
함수
geobubble|geoaxes|geoplot|geobasemap|geoscatter
속성
도움말 항목
- Use Basemaps in Offline Environments (Mapping Toolbox)